Fig. 11.

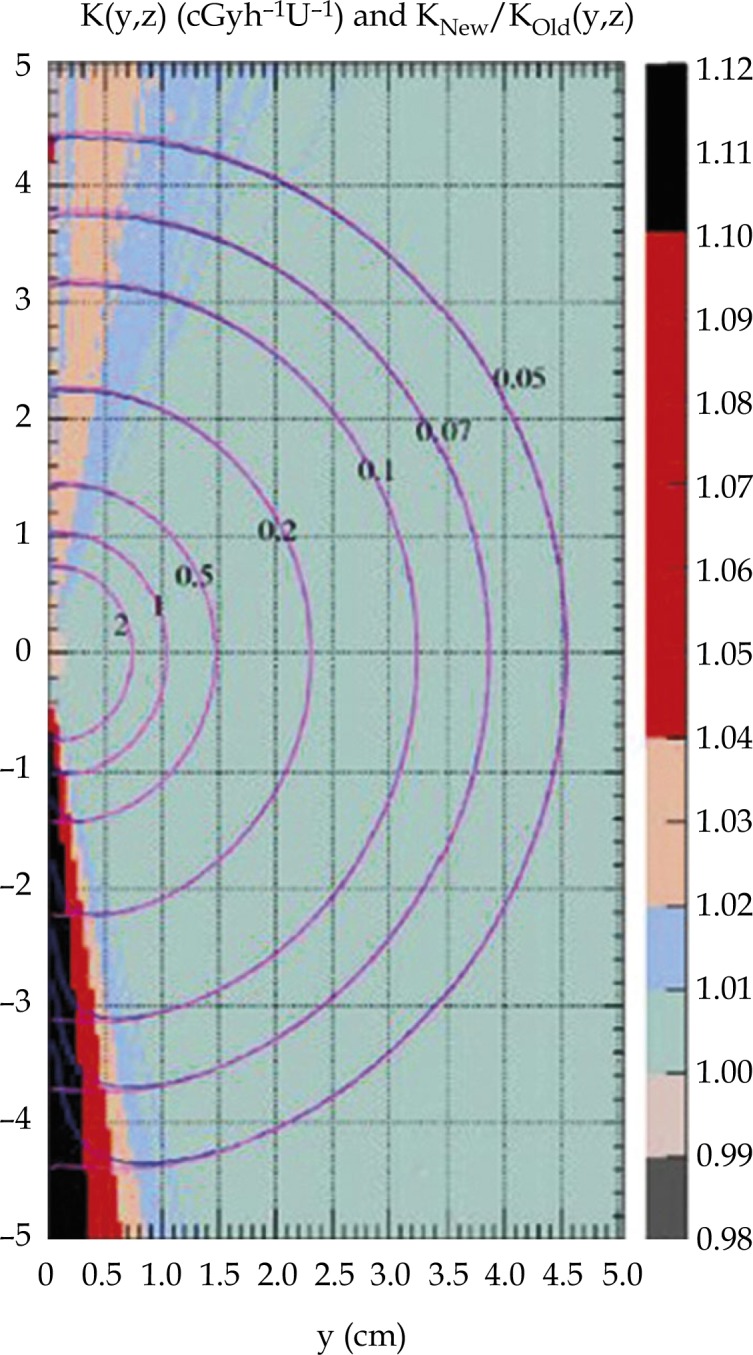
Isodose curves in cGyh–1 U–1 for the old and the new Bebig HDR source. The background is the ratio between the kerma rate distribution [20]

Isodose curves in cGyh–1 U–1 for the old and the new Bebig HDR source. The background is the ratio between the kerma rate distribution [20]