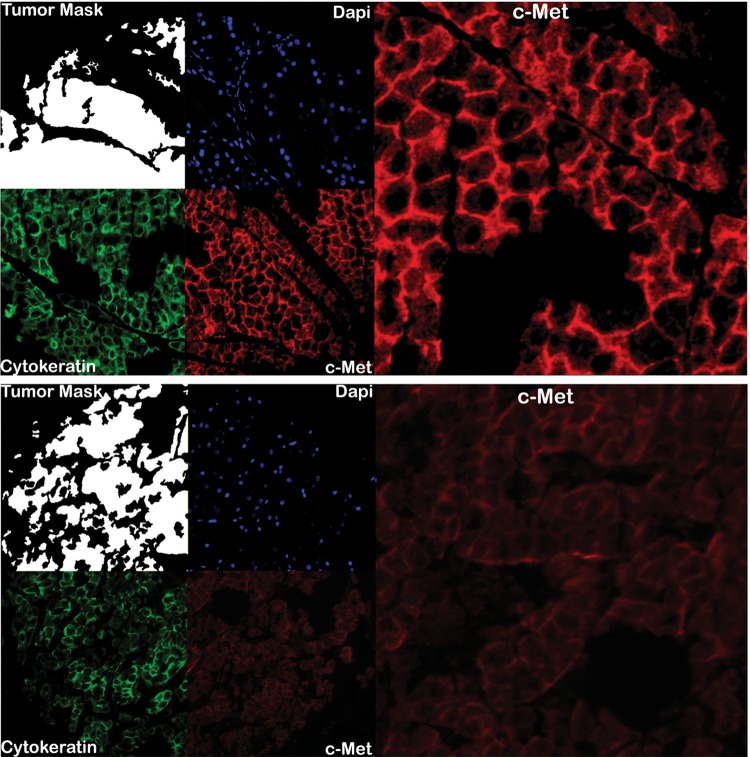
Figure 1.
Automated, quantitative analysis (AQUA) of histospots from high c-Met (upper) and low c-Met (lower) renal cell carcinoma (RCC) tumors. Anti-cytokeratin conjugated to Cy2 identified the cytoplasmic areas and was used to create the tumor mask (white). DAPI stained the nuclear component. Anti-c-Met antibody conjugated to Cy5 demonstrated cytoplasmic c-Met expression.

