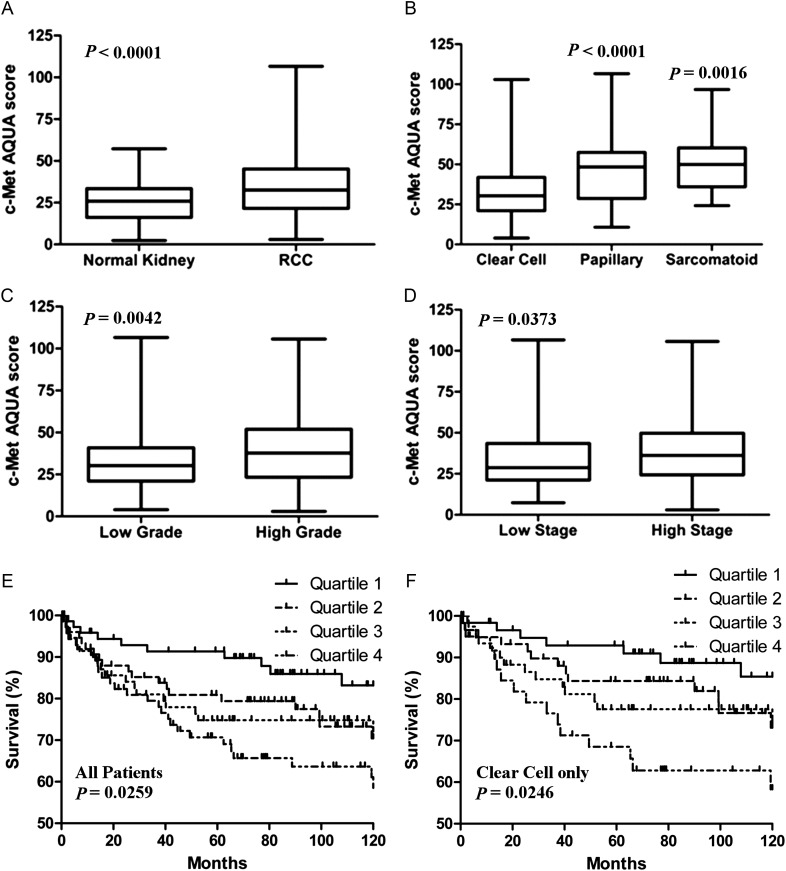
Figure 2.
Box plots and Kaplan–Meier survival curves of c-Met expression by AQUA score in renal cell carcinoma (RCC) tumors. (A) c-Met level was significantly greater in RCC compared with paired normal renal tissue. (B) c-Met was present in clear cell, papillary, and sarcomatoid RCC subtypes, with greater levels in papillary and sarcomatoid when compared with clear cell RCC. (C and D) c-Met level was significantly greater in tumors with higher grade and higher stage. (E and F) Kaplan–Meier analyses demonstrated worse RCC-specific survival for patients with the highest quartile of c-Met expressing tumors based on the AQUA score in both the entire cohort and the clear cell subset. Tick marks represent censored events. P values represent log-rank (Mantel-Cox) overall comparison for survival by c-Met quartile.

