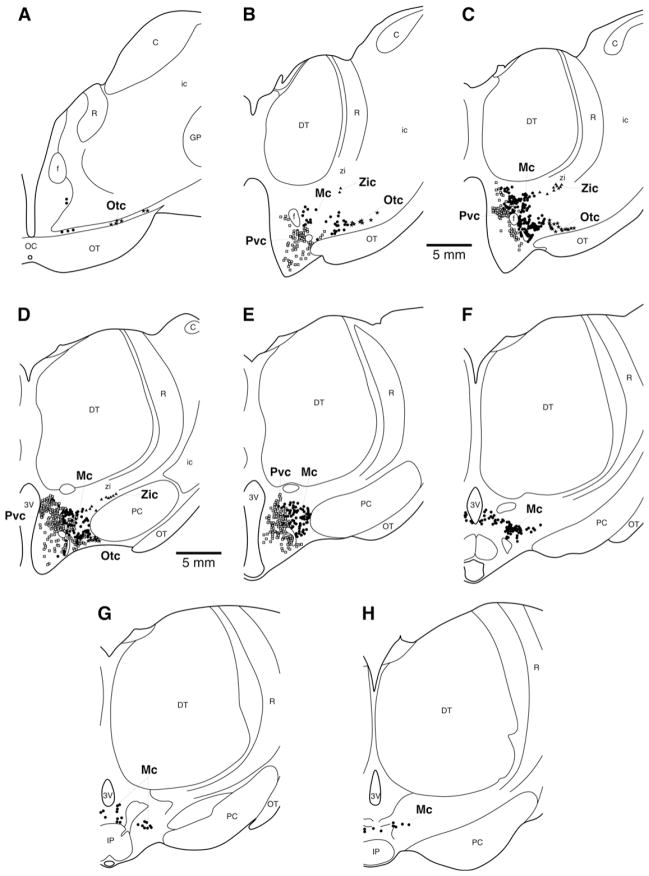
Fig. 3.
Drawings of coronal sections through one half of the giraffe diencephalon illustrating orexin-A immunoreactive neuron distribution. A single black dot indicates a single magnocellular orexinergic neuron while a single open square represents a single parvocellular orexinergic neuron. Drawing A represents the most rostral section, H the most caudal, and each drawing is approximately 500 μm apart. In all drawings, medial is to the left and dorsal to the top. See list for abbreviations.

