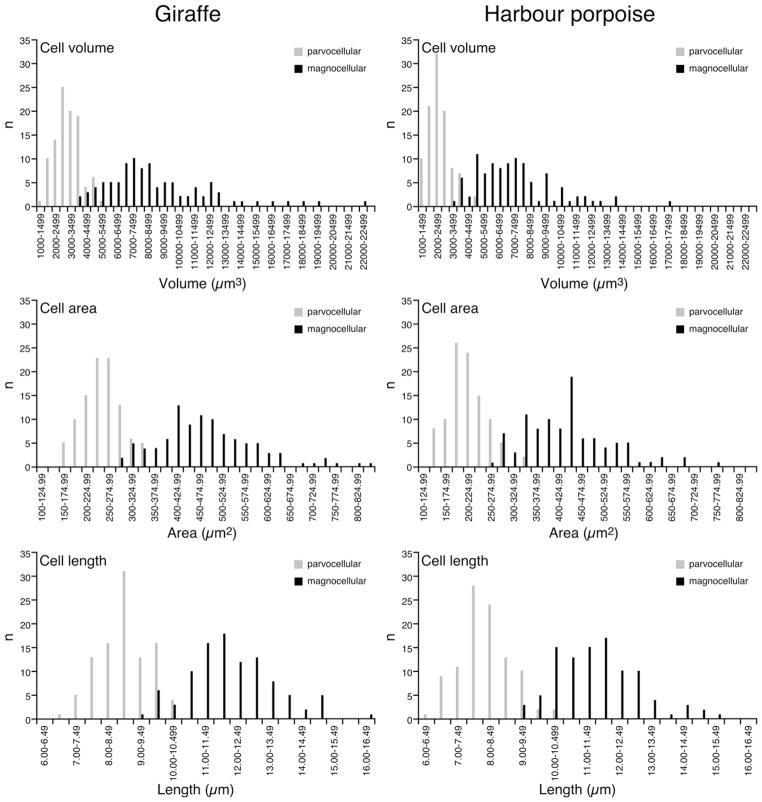
Fig. 8.
Graphs showing the frequency distribution of orexinergic cellular volumes (upper two graphs), areas (middle two graphs) and lengths (lower two graphs) in the sampled giraffes (left column of graphs) and harbour porpoises (right column of graphs). As can be seen for all three parameters, the distinction between parvocellular and magnocellular orexinergic neurons is quite clear, despite a small overlap in the distributions.

