Fig. 8.

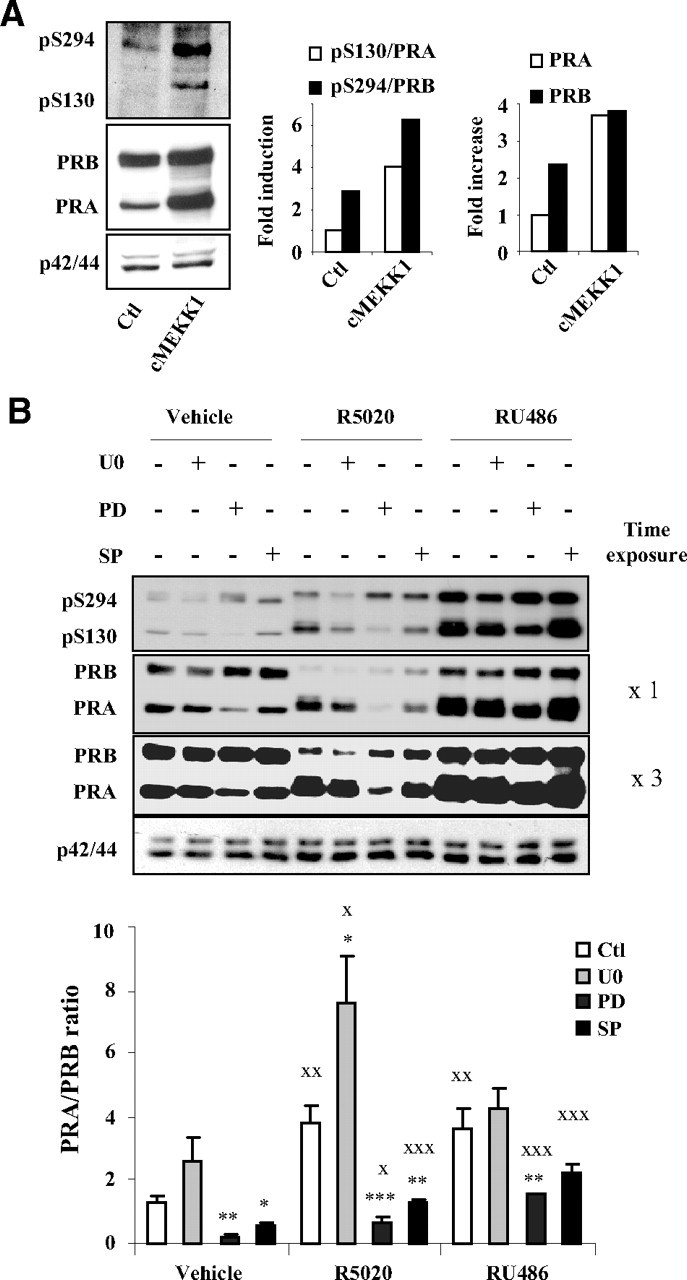
Distinct MAPK control PRA/PRB expression ratio. A, Ishikawa cells stably coexpressing PRA and PRB (Ishikawa PRAB) were transiently transfected with empty control (Ctl) vector or cMEKK1 expression vector during 24 h, and pS294-PRB or pS130-PRA levels or total PRB or total PRA levels were detected by immunoblotting whole cell extracts using phospho-specific or total PR or p42/44 antibodies. Band intensities were quantified, and pS130/PRA or pS294/PRB (middle panel) as well as total PRA and PRB levels (right panel) under basal and cMEKK1 conditions are presented. B, Ishikawa PRAB cells were pretreated with vehicle control (Ctl) or selective inhibitors of p42/44 (U0126) (UO) or p38 (PD169316) (PD) or JNK (SP600125) (SP) activity. Cells were then transfected with MEKK1 expression vector in the presence of vehicle or R5020 (10−8 m) or RU486 (10−8 m) during 24 h. Whole cell extracts were immunoblotted as in Fig. 7B. Band densities corresponding to PRA and PRB were quantified from at least two nonsaturating exposures of the same immunoblot (two film exposures are shown). PRA/PRB expression ratio was calculated for each ligand and inhibitor condition from three independent cell cultures and presented as mean ± sem. Under a given ligand condition, the effect of selective MAPK inhibition as compared with nontreated cells is shown by asterisks. Statistical significance is shown by XX when the effect of ligand is compared with vehicle under a given MAPK inhibition. *, P ≤ 0.05; X, P ≤ 0.05; **, P ≤ 0.01; XX, P ≤ 0.01; ***, P ≤ 0.001; XXX, P ≤ 0.001.
