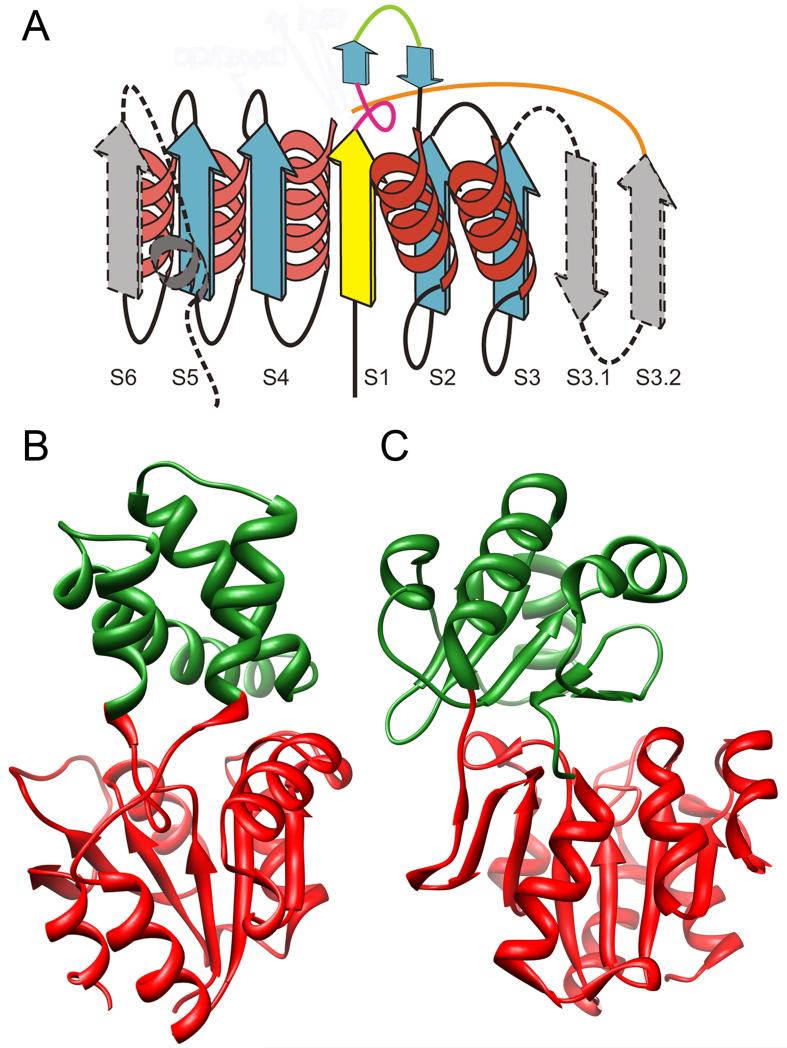
Figure 1.
Topologies of HAD and Cap domains. A. Schematic diagram of the classic HAD domain: yellow, strand containing the catalytic asp residue; blue, core strands conserved in all HAD SF members; gray, structural elements that may not have occurred in the ancestral structure; green line shows the insertion point for C1 caps; orange line shows the insertion point for C2 caps. Broken lines indicate secondary structure elements not present in all members containing the HAD domain. Figure adapted from [9]. B. Crystal structure of L-2-haloacid dehalogenase with 2-Chloro-N-Butyrate (ligand not shown) (PDB 1ZRM) showing the HAD domain in red and the C1 cap domain in green. C. Crystal structure of the HAD subclass IIB sugar phosphatases (PDB 1YMQ) showing the HAD domain in red and the C2 cap domain in green.

