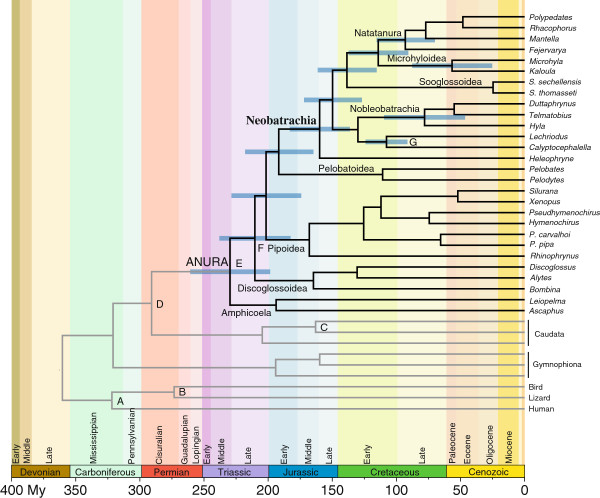
Figure 2.
Timetree with age estimates of major divergence events among frogs. The tree was estimated using Bayesian relaxed dating methods (BEAST) and based on the combined nucleotide data set. Outgroup species are depicted with grey branches, horizontal blue bars represent 95% credibility intervals of relevant nodes, and calibration constraints are indicated on the corresponding nodes (A to G; see Additional file 2). Scale axis is in millions of years (My).

