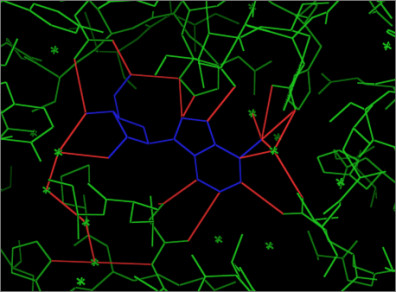
Figure 2.

An example of an interfacial graph for “adenosine deaminase” with PDB code “1a4m”. The protein is shown in Green, the ligand in Blue, and the edges (in Red) are connecting interacting (interfacial) atoms within a distance cutoff 3.15 Ǻ. The interfacial graph is composed of the interfacial atoms the edges (in Red) which are connecting these atoms. Notice that if water molecules are not eliminated, they will be part of the graph forming a bridge between the ligand and protein interfacial atoms.
