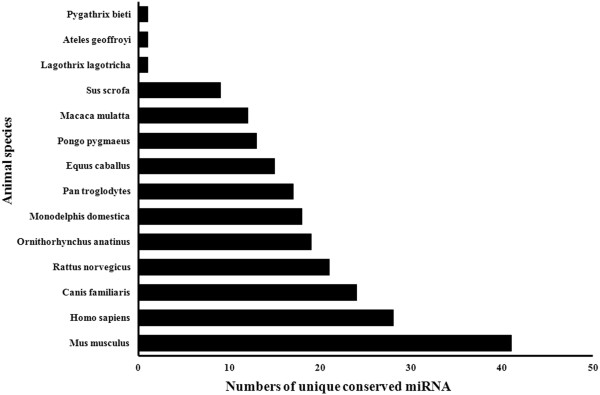
Figure 4.

The conservation profile of conserved bovine miRNAs. These sequences were mapped to other mammalian genome assemblies and shared highly similar sequences. Values on the X axis indicate the number of unique conserved miRNAs between bta and the queried species.
