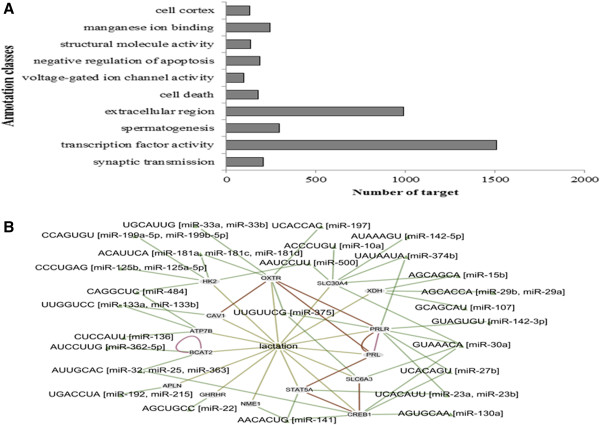
Figure 7.

Prediction of miRNA targets and lactation network. (A) Gene ontology annotation analysis of miRNA targets. (B) The constructed lactation network of miRNAs. In the network, miRNAs are represented by triangles, and target genes are represented by grey nodes. Green lines represent miRNA-target interactions, brown lines denote gene-gene pathway interactions, and pink lines represent the NHGRI GWA catalog.
