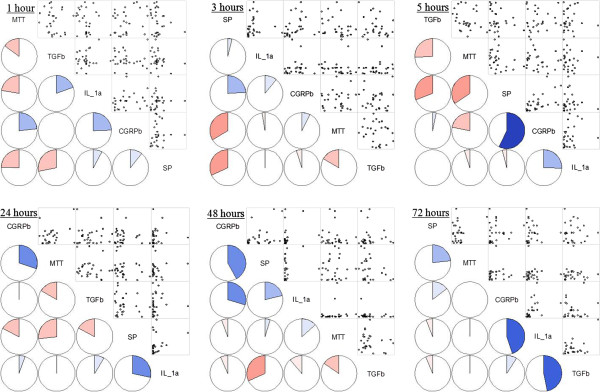
Figure 5.

Pearson’s correlation analysis between between 5 variables at each time. Analysis reveals no correlation except the CGRP against interleukin-1α after triamcinolone acetonide treatment 72 hours after triamcinolone acetonide treatment. Left lower half: Corrgram shows the correlations by the color and intensity. Right upper half: Typical scatter plot. SP = Substance P, CGRP = Calcitonin gene related peptide, IL-1α = Interleukin-1α, TGF-β = Tumor growth factor-β, MTT = 3-(4,5-dimethylthiazol-2-yl)-2,5-diphenyl-tetrazolium bromide (MTT) assay.
