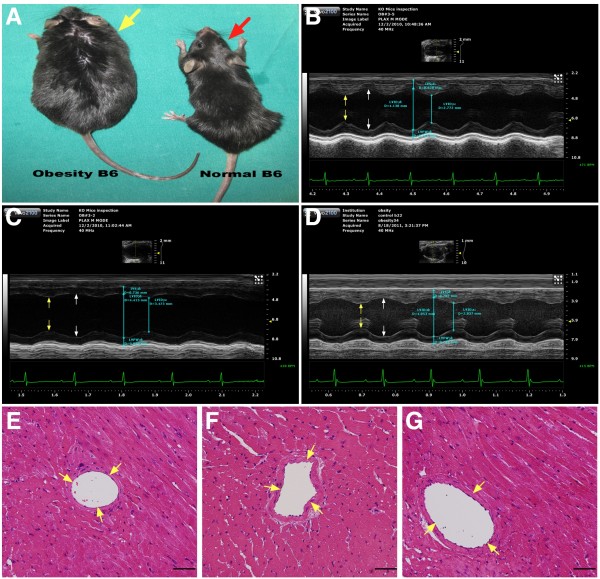
Figure 1.
General appearance, illustration of M-mode echocardiography and pathological findings in among three groups of animals (n = 8 for each group). A) Comparison of general appearance of obesity mouse (yellow arrow) and normal B6 mouse (red arrow) at the study period. B) to D) Showing both systolic (yellow arrows) and diastolic (white arrows) dimensions were notably dilated in obesity mouse (C) than in normal control (B) that were revised by obesity reduction (D). E) to G) The results of H & E stain showed no obstructive coronary artery disease was noted among normal (E), obesity (F) and obesity reduction (G) animals.

