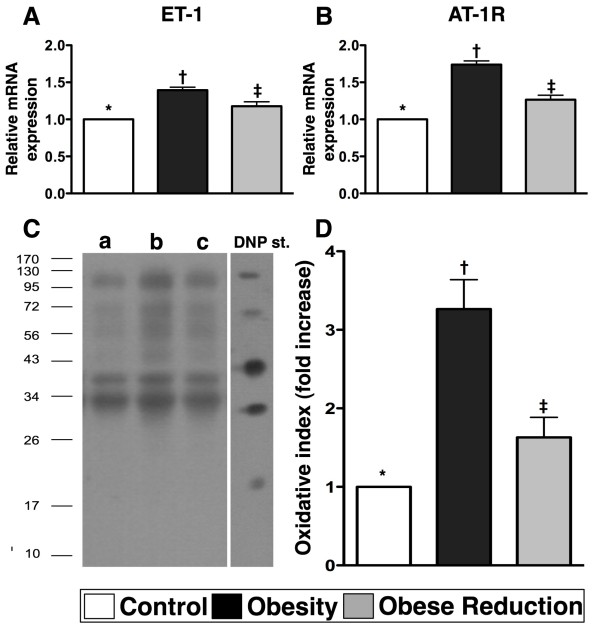
Figure 3.
The mRNA and protein expressions of vasoconstriction and oxidative-stress markers (n = 8 for each group) .A) and B) The mRNA expressions of endothelin (ET)-1 and angiotensin II type I receptor (AT-1R), two indicators of vasoconstrictions/impairment of microcirculation, were remarkably increased in obesity group than in control and obese-reduction groups, and notably increased in obese-reduction group than in control group. * vs. † vs. ‡, p<0.001. C) Showing the Western blot of oxidized protein (Note: Right lane and left lane shown on left lower panel represent control oxidized molecular protein standard and protein molecular weight marker, respectively). DNP = 1–3 dinitrophenylhydrazone. a = normal, b = obesity, c = obese reduction. D) Showing significantly higher oxidative index, protein carbonyls, in obesity group than in normal and obese-reduction groups, and significantly higher in obese-reduction group than in control group. * vs. † vs. ‡, p<0.001. All statistical analyses using one-way ANOVA, followed by Bonferroni multiple comparison post hoc test. Symbols (*, †, ‡) indicate significance (at 0.05 level) among A), B), and D).

