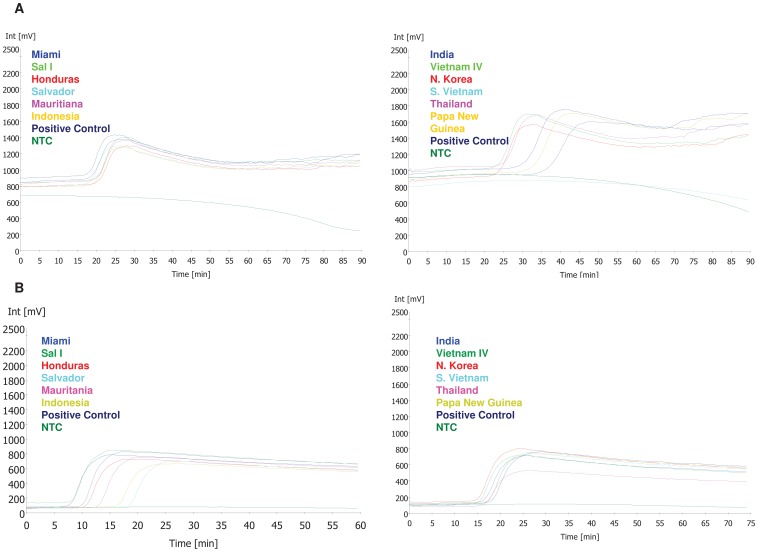
Figure 1. Amplification plots for P. vivax strains from different geographic locations using the r64 primer set with SYBR green (A) and SYTO-9 (B).
Amplification plots from P. vivax strains from Pakchong, Chesson and Panama are not shown. Amplification of the template DNA measured in millivolts (mV) on y-axis over time on x-axis. Any amplification observed after 60 minutes of test time was considered negative. A known P. vivax DNA sample was used as the positive control. NTC; No Template Control.

