
Figure 4. Histogram of maximum ladder distance values calculated for STMV RNA and shuffled STMV RNA sequences.
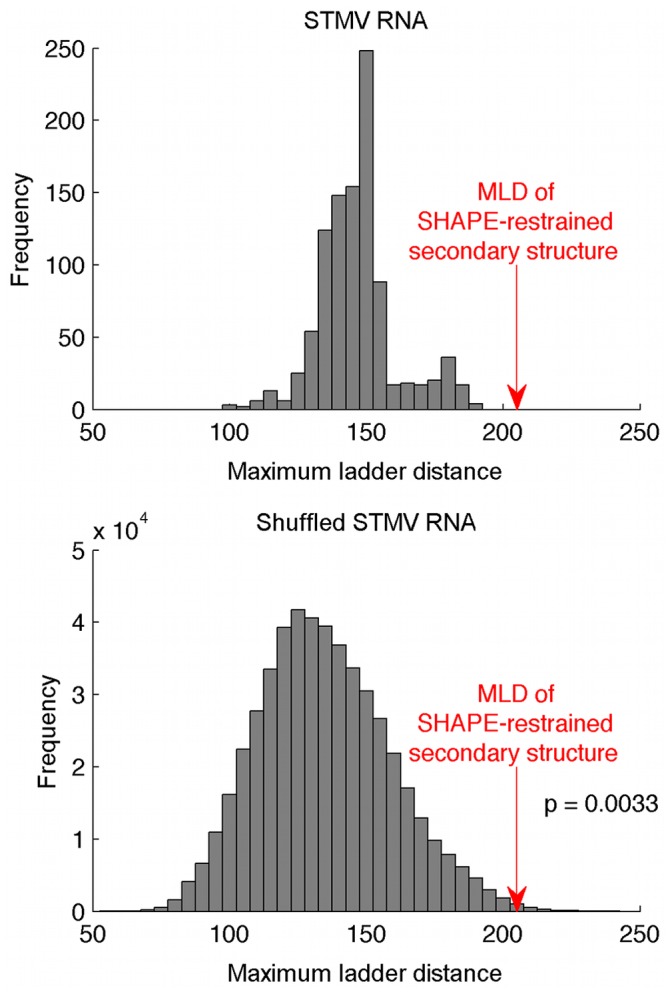
The MLD of the SHAPE-restrained structure is much higher than the MLDs of 1000 suboptimal structures predicted for the STMV RNA sequence (top). The extreme MLD of the SHAPE-restrained structure is unlikely to have occurred by chance: the bottom histogram was obtained using 1000 suboptimal structures for each of 500 randomly shuffled sequences with the same length and nucleotide composition as STMV. Fewer than 0.4% of these structures have MLDs greater than the MLD of the SHAPE-restrained STMV structure.