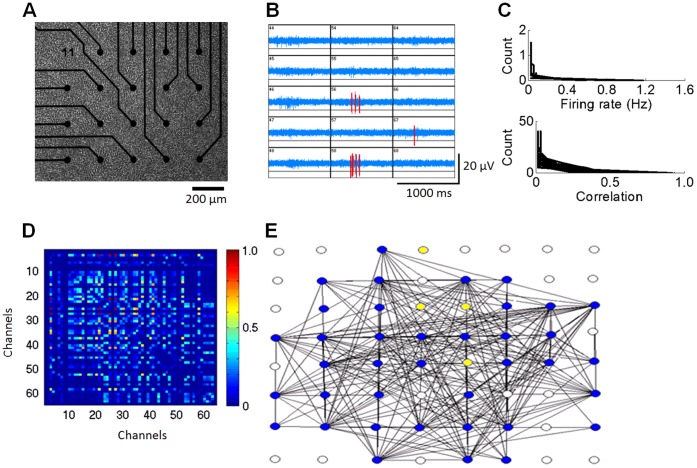
Figure 1. Experimental procedure for reconstructing functional networks of cultured cortical neurons. A.
Rat cortical neurons plated on a 64 electrode microelectrode array (MEA) (only a subset of electrodes shown). Electrodes are spaced 200 µm apart and record the extracellular activity of nearby neurons. B. Example of extracellular spikes measured over a subset of 15 electrodes simultaneously. Red: spikes. Blue: background activity. C. Histograms of mean firing rates per channel (top) and cross-correlations between pairs of channels (bottom), taken over all DMSO cultures recorded at DIV 14 (N = 5). D. Representative matrix of pairwise cross-correlations obtained across all recording electrodes. The diagonal (activity at each channel compared to itself) is set to zero. E. Graph obtained by the permutation test (see Experimental Procedures). Circles correspond to electrodes on the MEA. Lines show above-chance cross-correlations. Blue: active electrodes; white: inactive electrodes (extracellular spike rate less than 3 S.D. below that of the population); yellow: active electrodes with no above-chance correlation to other electrodes. A–D: obtained with a DMSO control culture (DIV 14).

