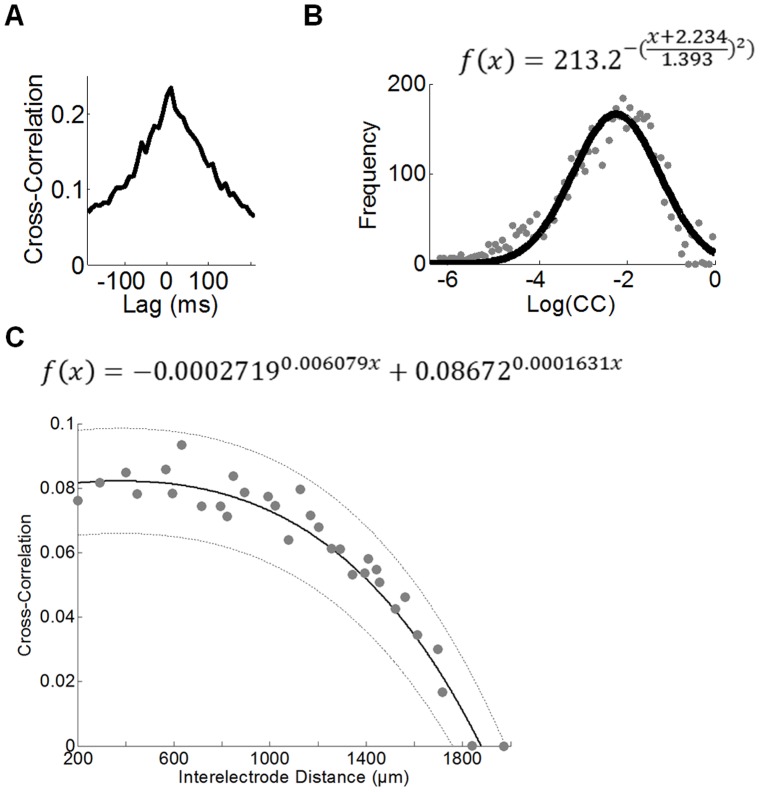
Figure 4. Baseline properties of functional connectivity in cortical networks.
A. Representative cross-correlogram in a DMSO culture at baseline (DIV 14). The mean cross-correlation across all pairs of recording electrodes is highest at 0 ms time-lag. B. The distribution of pairwise cross-correlations (gray dots) is fitted by a lognormal distribution (solid line). Adjusted r 2 = .93. C. Relationship between cross-correlation and physical distances between electrodes on the MEA. Grey dots: individual data points of correlation between pairs of electrodes. Solid line: fitted exponential function. Dotted lines: 99% confidence intervals. Adjusted r 2 = .85. B–C are taken over all DMSO cultures from DIV 14 (N = 5).

