Figure 2.
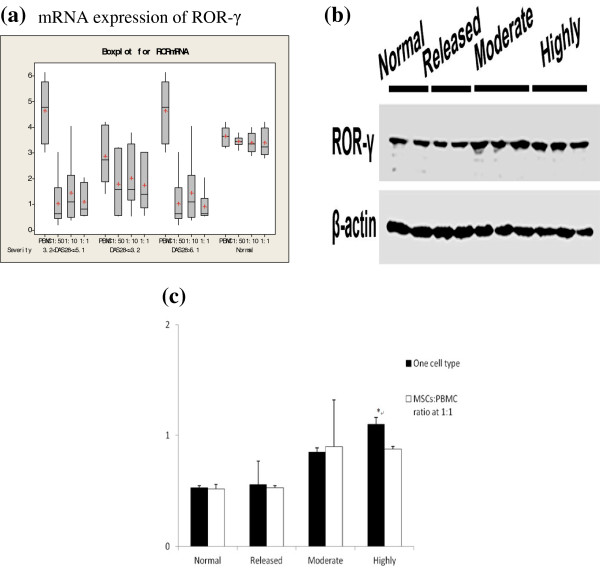
Expression of ROR-γ. a, mRNA expression of ROR-γ; b, Protein expression of ROR-γ in different groups after co-culture as measured by Western blotting. β-actin was used as control; c, ROR-γ expression levels in groups of MSCs: PBMC mixed ratio at 1:1 group (n = 6). *: P < 0.05, vs. 1:1 within the expression level.

