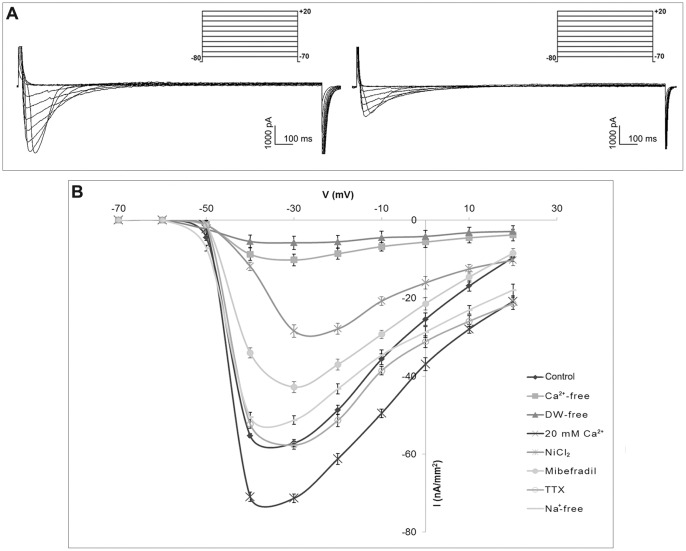
Figure 5. Pharmacological characterization of Ca2+ currents in GV-C oocyte of Styela plicata.
A) Representative traces of voltage protocol and current records obtained by applying depolarizing voltage step between −70 mV and +20 mV, with subsequent 10 mV increments, from holding potentials of −80 mV in control experiment (left) and after NiCl2 treatment (right). B) Average current-voltage relationship (I/V curve) showing the effects of modified ASW and pharmacological agents (NiCl2; TTX; mibefradil) on control currents. All I/V curves are obtained by averaging the data from twenty oocytes. Error bars indicate S.E.

