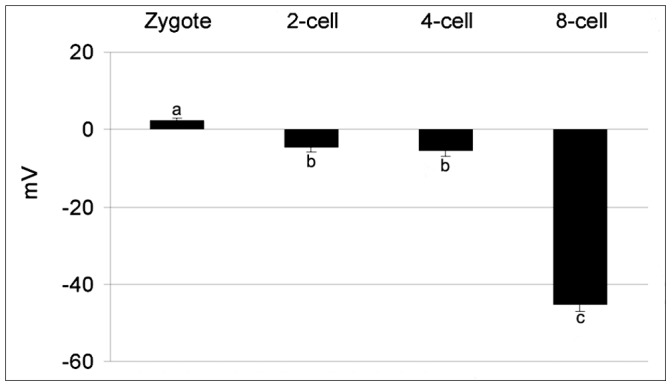
Figure 6. Membrane resting potential during embryo development in Styela plicata.

The RP (means ± S.E.) shows positive values in the zygote. Negative values increased from 2-cell stage up to 8-cell stage (a vs b vs c P<0.01).

The RP (means ± S.E.) shows positive values in the zygote. Negative values increased from 2-cell stage up to 8-cell stage (a vs b vs c P<0.01).