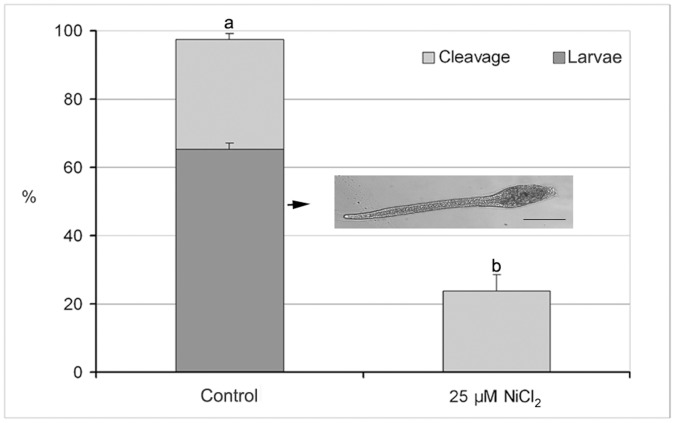
Figure 8. Effect of Ca2+ current inhibition on fertilization rate of Styela plicata.
Light shading shows percentage of first cleavage (2-cell stage) of GV-C oocyte fertilized in ASW (control) and in NiCl2 (a vs b P<0.01). Dark shading shows percentage of 2-cell stage that reached the larval stage. Insert reports a normally developed Styela plicata larva 24 h after fertilization. Bar is 240 µm.

