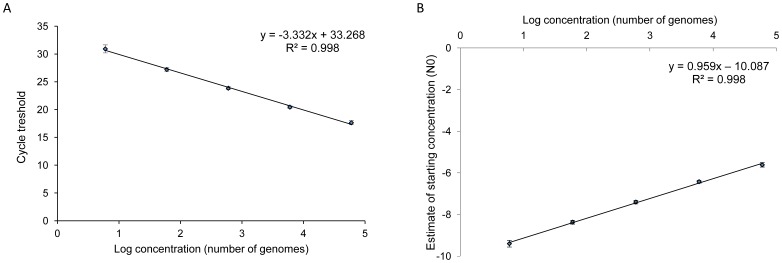
Figure 1. Standard curve of qPCR using serial dilutions of DNAs from cultured parasites.
A, Standard curve was obtained by linear regression analysis of Ct values versus log10 copy number of cultured parasites in DNA standards (6 to 6×10⁴ genomes/µl). The slope was calculated from 53 independent reactions for each serial dilution. Errors bars show the standard deviation. B, Calibration curve for absolute quantification representing the starting concentrations of DNA standards (N0), expressed as arbitrary fluorescent units, versus log10 input copy numbers of cultured parasites (6 to 6×10⁴ genomes/µl). N0 were calculated for each sample of the serial dilutions using the LinRegPCR software. The curve shows a good correlation of the N0 values with the estimate parasite number in serial dilutions (slope = 0.952, and R2>0.998). The calibration curve was used to convert the starting concentration of parasites in each mosquito midgut into the number of genomes/µl.

