
Figure 2. Betweenness and percolation centrality profiles of the Alberta model network with  , with node sizes matching the centrality values.
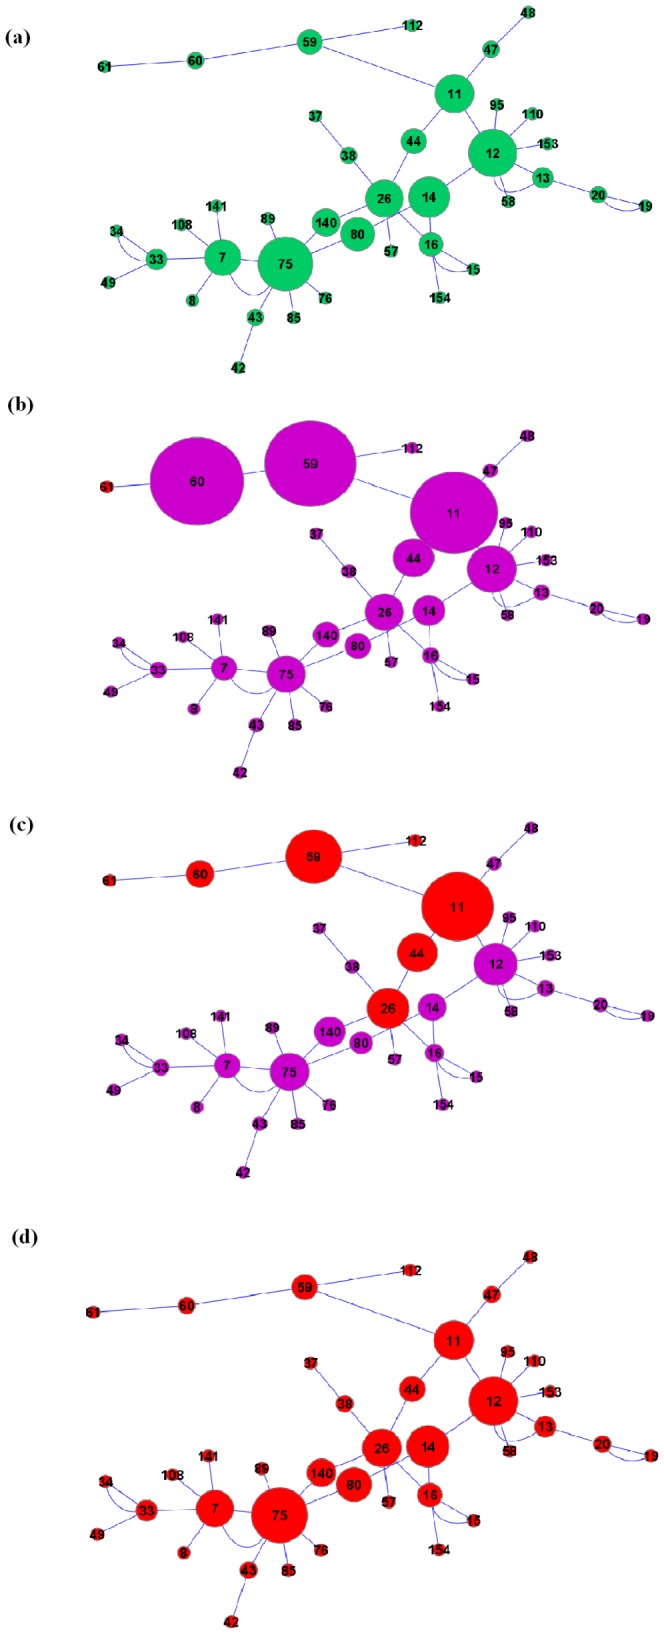
(a) The betweenness centrality of nodes; independent of time. (b) The percolation centrality of nodes at  . (c) The percolation centrality of nodes at
  . (d) Percolation centrality of nodes at
  . The infected nodes are highlighted in red.