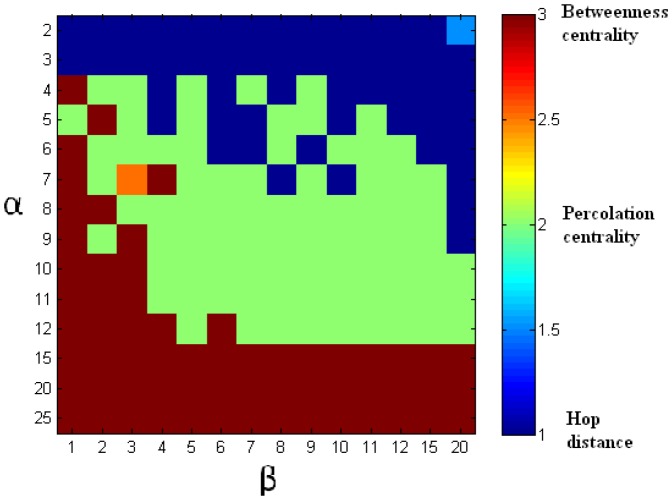
Figure 6. Scale-free network: the ranges of  and
and  for which the various centrality measures show the best performance.
This figure corresponds to Table 1. Red: best performance by betweenness centrality based intervention ( %). Green: best performance by percolation centrality based intervention (
 %). Blue: best performance by hop distance based intervention (
 %). Intermediate colours represent ties (
 %).
%).

