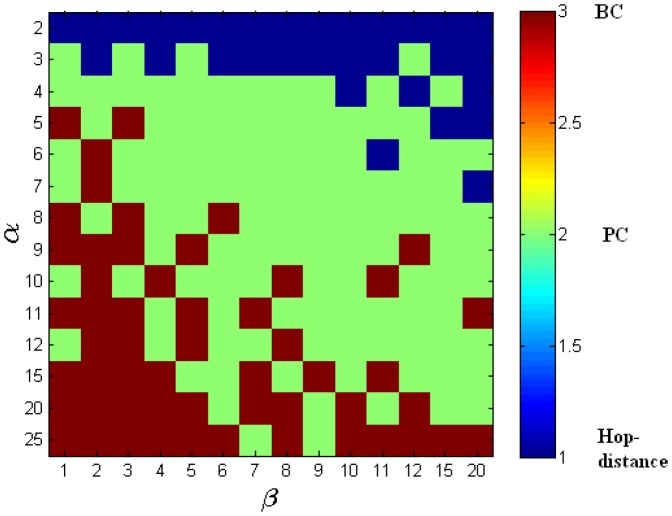
Figure 7. Random network: the ranges of  and
and  for which the various centrality measures show the best performance.
This figure corresponds to Table 2. Red: best performance by betweenness centrality based intervention ( %). Green: best performance by percolation centrality based intervention (
 %). Blue: best performance by hop distance based intervention (
 %).
%).

