
Figure 4. Comparison of Performance of the Model and Monkey.
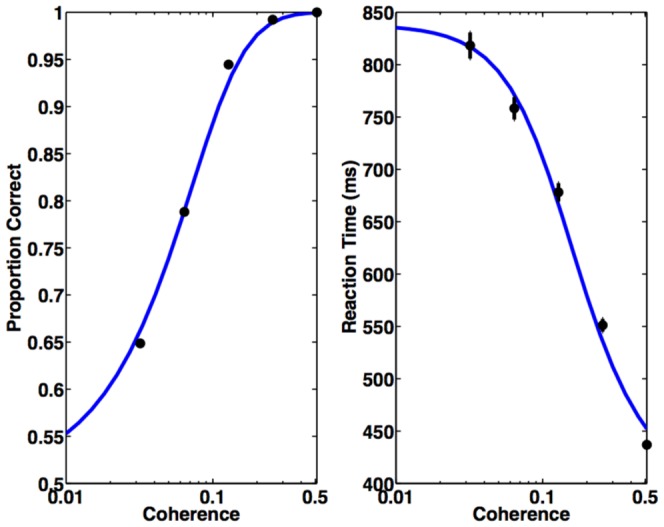
Black dots with error bars represent a monkey's decision accuracy and reaction time for correct trials. Blue solid curves are model predictions ( and
and  in the text) for parameter values
  , and
, and  . Monkey data from [31].