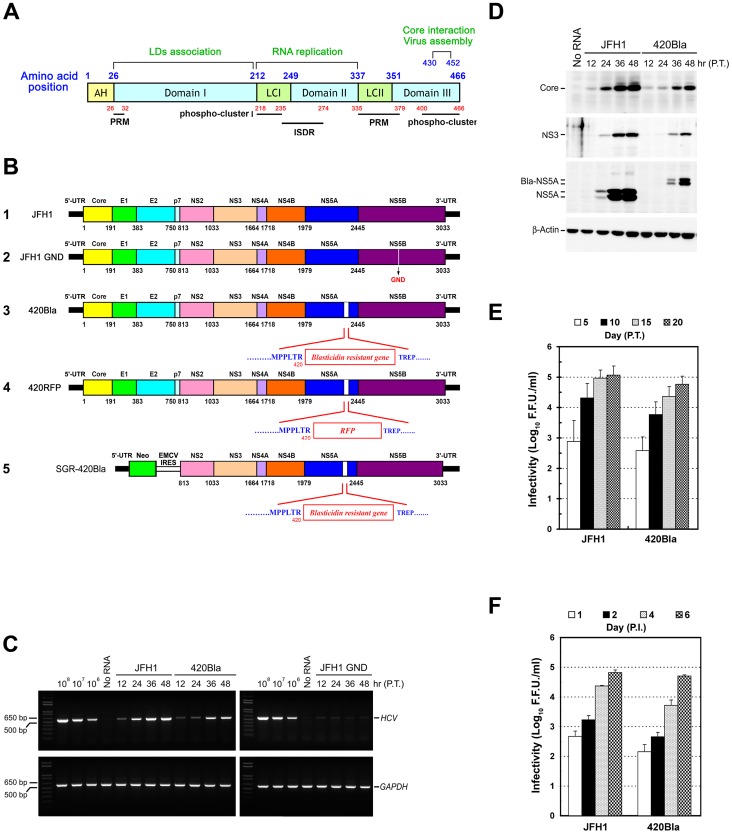
Figure 1. Construction and characterization of the HCV 420Bla virus.
(A) Schematic representation of the domain organization of JFH1 NS5A. The locations of the N-terminal amphipathic helix (AH), three domains I, II, and III, and two low complexity (LC) regions are marked by the numbers shown on the top of the scheme. The two major phospho-clusters in LCI and Domain III represent the identified residues of hyperphosphorylation, and their corresponding regions are numbered below the scheme. The interferon sensitivity determining region (ISDR) and two proline-rich motifs (PRM) are marked by thick lines. (B) Schematic diagram of HCV RNA constructs used in this study. The relative regions of individual viral proteins encoded by JFH1 genome are represented according to their a.a. positions labeled on the translated polypeptide (scheme 1). The “GND” indicates a substitution at the 328 a.a. position of NS5B, converting the GDD motif to GND and inactivating the RNA polymerase activity of NS5B (scheme 2). The Bla gene was inserted at the 420 a.a. position of NS5A to yield the 420Bla genome (scheme 3). The 420RFP genome was generated by insertion of the RFP gene at 420 a.a. residue of NS5A (scheme 4). The SGR-420Bla genome (scheme 5) was constructed as described in “Materials and Methods”. (C) Huh7 cells were transfected with JFH1 or 420Bla RNAs, and the total RNAs isolated at the indicated times were analyzed by semi-quantitative RT-PCR using core- and GADPH-specific primers. P.T.: post-transfection. (D) Transfected cells were harvested at the indicated times and analyzed for expressions of core, NS3, NS5A, and β-Actin. Bla-NS5A: NS5A with a Bla insertion. (E) Huh7 cells were transfected with indicated viral genomes, and culture supernatants collected at different times were analyzed for the viral infectivity expressed as the foci forming unit (F.F.U.)/ml. (F) Huh7 cells were infected with the indicated viruses at an MOI of 0.01 for 12 hr, and culture supernatants harvested at the indicated times were determined for the viral infectivity. P.I.: post-infection. Data represents mean ± standard error of mean (SEM) (n = 3) (E and F).

