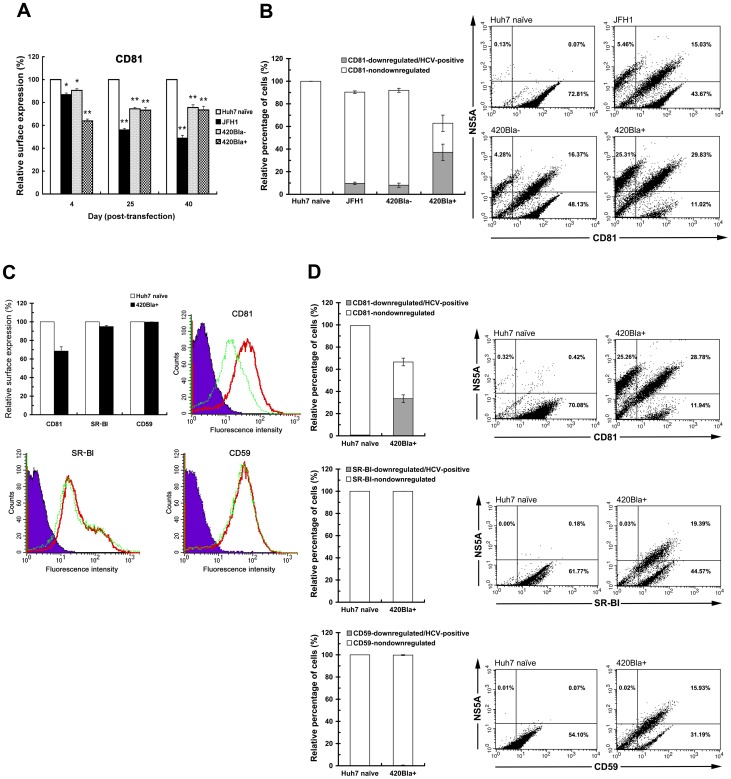
Figure 8. Downregulated CD81 surface level in 420Bla+ stable and chronically infected cells.
(A) In parallel to the reinfection analysis of Figure 6A, the cell surface-expression of CD81 on Huh7 naive, JFH1, 420Bla−, and 420Bla+ cells was quantified by flow cytometry. The relative cell surface expression of CD81 at each time point was calculated by normalization with that of Huh7 naïve cells in the same set of samples. (B) Huh7, JFH1, 420Bla−, and 420Bla+ cells established as described in (A) were doubly stained for surface CD81 and HCV NS5A expression as described in “Materials and Methods”. A set of representative results from three independent experiments was shown in the right as two-dimension dot plots. The percentage of CD81-downregulated/HCV-positive cells was determined by calculating the ratio of cells located in the upper-left square to the total cells in each panel under different conditions. The percentage of “CD81-nondownregulated” cells was determined by calculating the ratio of the CD81 fluorescence-positive cells (upper-right and lower-right squares) to the total cells in each panel. In each calculation, the relative percentage of the ratio calculated under different conditions was quantified by normalization with that of Huh7 naïve cells. (C) Huh7 naïve and 420Bla+ stable cells as described above were analyzed for the cell surface expressions of CD81, CD59, and SR-BI. The histograms shown are a set of representative results from three separate CellQuest analyses. The purple shaded area, red solid line, and green dashed line indicate the IgG isotype control, Huh7 naïve cells, and 420Bla+ stable cells. (D) The Huh7 and 420Bla+ stable cells as described in (C) were doubly stained for the surface expression of indicated cell surface molecules and HCV NS5A as described in (B). The relative percentages of indicated surface molecule downregulated/HCV-positive and nondownregulated cells were quantified and calculated as described in (A). The two-dimension dot plots shown are the representative results from three independent experiments. Data represents mean ± SEM (n = 3). The statistical significances of the differences between the indicated and Huh7 naïve cells in (A) are determined by the two-tailed unpaired Student's t-test of the means (*P<0.05 and **P<0.01).

