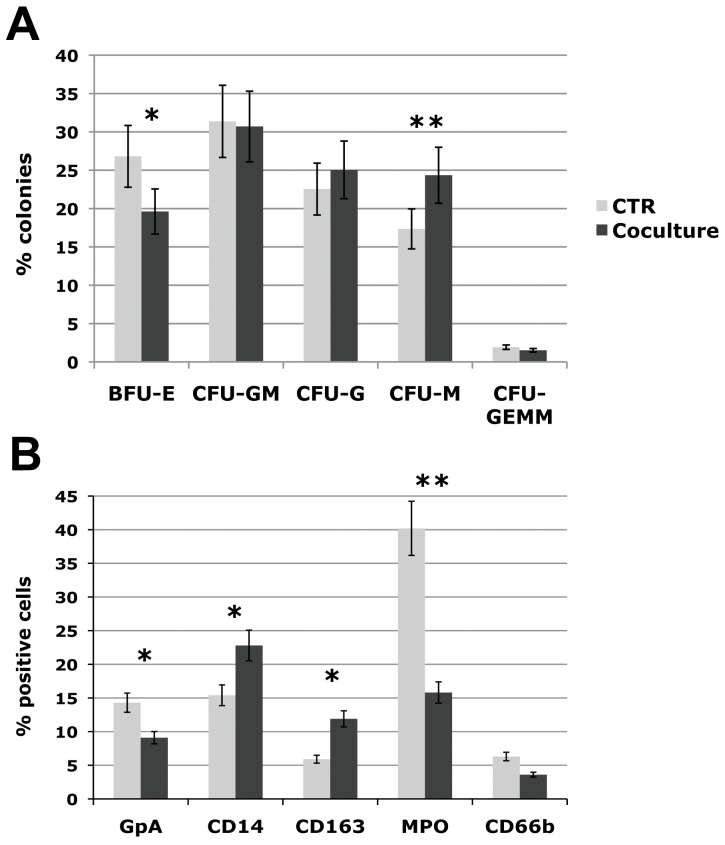
Figure 2. Differentiation capacity of CTR and co-cultured CD34+ cells.
(A) Results of statistical analysis of methylcellulose-based clonogenic assay performed on CD34+ cells plated after 3 days of co-culture with human OBs and scored after 14 days. (A) Count of different colony types; (B) Results of statistical analysis on the percentage of cells positive for hematopoietic lineage differentiation markers (GPA, CD66b, MPO, CD14, and CD163) performed by flow cytometry at day 10 and 14 of co-culture. Values are reported as mean ± 2S.E.M., * = p≤0.05 vs CTR, ** = p≤0.001 vs CTR. The results come from five independent experiments. Abbreviations: BFU-E, Burst forming unit-erythroid; CFU, Colony forming unit; E, erythrocyte; G, granulocyte; M, monocyte; GM, granulocyte-monocyte; GEMM, granulocyte-erythrocyte-monocyte-megakaryocyte.

