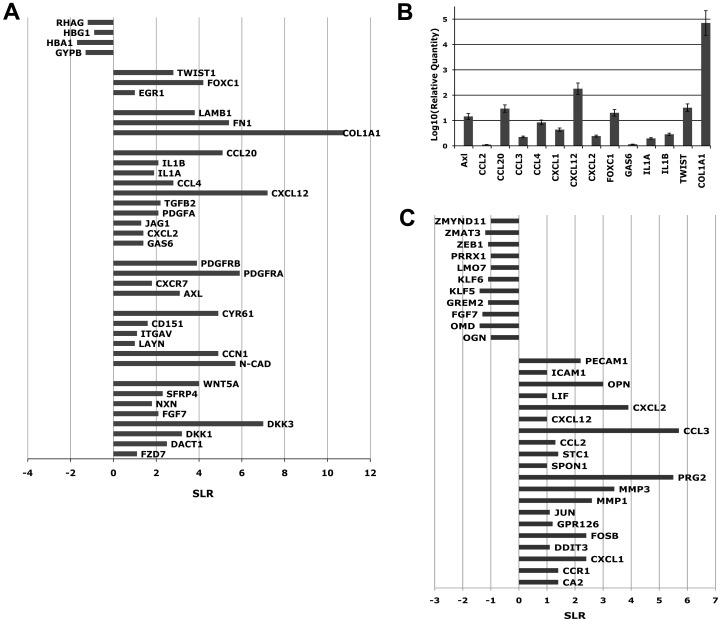
Figure 3. Changes in gene expression profile induced by co-culture in OBs and CD34+ cells.
(A) Microarrays analysis was performed at day 3 of co-culture on pooled RNAs from Control and co-cultured CD34+ cells from five independent experiments. Changes in gene expression are reported on the x-axis as signal log ratio (SLR). (B) Expression levels of 13 genes selected as differentially expressed from microarrays data. Gene expression levels were measured by Real-Time Quantitative Polymerase Chain Reaction PCR (RTQPCR) starting from total RNA and were expressed as log10 of Relative Quantity. Results come from five independent experiments. (C) Results of microarrays analysis performed at day 3 of co-culture on pooled RNAs from Control and co-cultured OBs from five independent experiments. Changes in gene expression are reported on the x-axis as signal log ratio (SLR).

