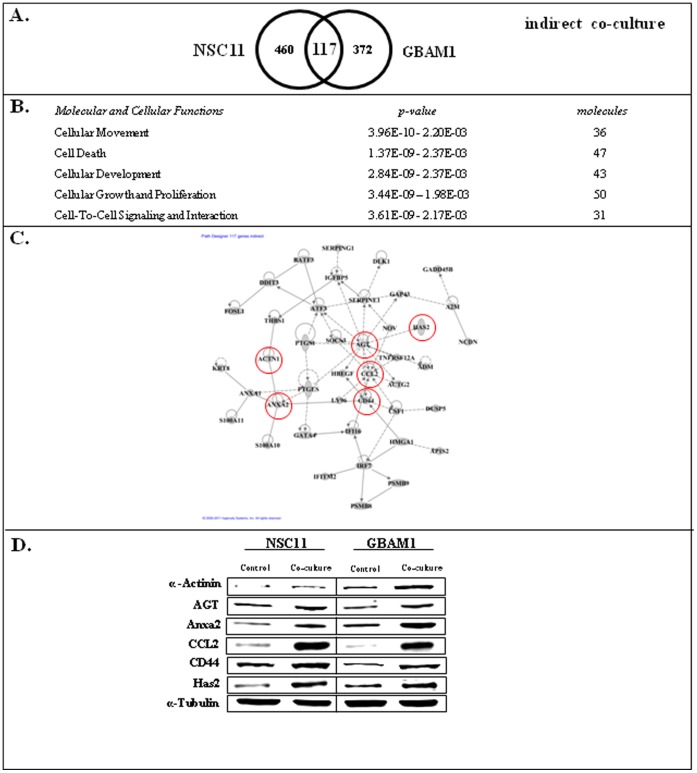
Figure 3. GSC gene expression changes induced by indirect co-culture with astrocytes.
A) Venn diagram comparing affected genes in CD133+ NCS11 and GBAM1 cells. B) Commonly increased genes (117) were subjected to IPA and the top five molecular and cellular function categories are shown. C) Interconnecting network formed by 42 of the 117 genes whose expression was commonly increased in NSC11 and GBAM1 CD133+ cells as a result of indirect co-culture with astrocytes. D) Immunoblots generated from GSCs 48 hours after seeding onto po/ln coated trans-well membranes without (control) and with astrocytes (co-culture) in the bottom well. Blots are representative of 2 independent experiments.

