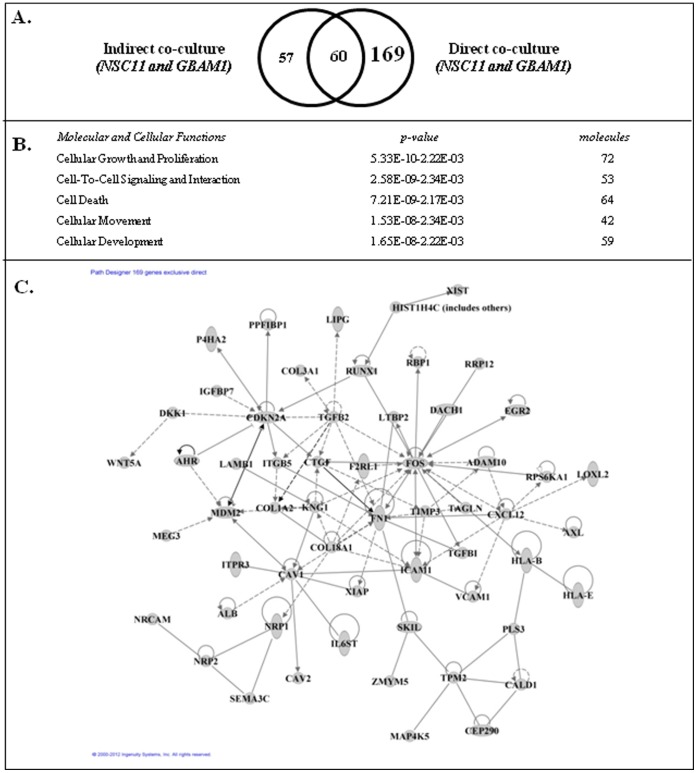
Figure 5. Comparison of GSC gene expression changes induced by indirect and direct co-culture with astrocytes.
A) Venn diagram comparing genes whose expression was increased in both CD133+ NCS11 and GBAM1 cells after indirect and direct co-culture with astrocytes. B) Genes commonly affected only in direct co-culture with astrocytes (169) were subjected to IPA; the top five molecular and cellular function categories are shown. C) Interconnecting network formed by 58 of the 169 genes whose expression was increased in both NSC11 and GBAM1 CD133+ cells only as a result of direct co-culture with astrocytes.

