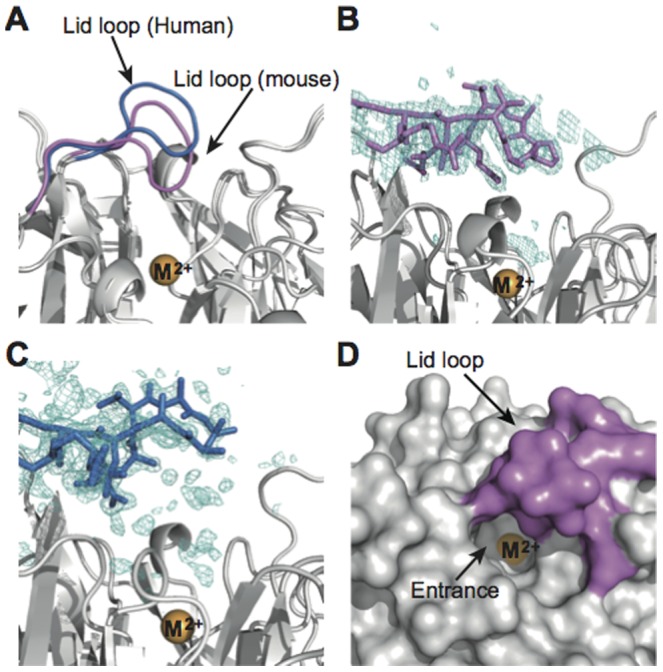
Figure 3. Structural comparison of the lid loops of mouse and human SMP30/GNL.

(A) Lid loops of mouse and human SMP30/GNL in the substrate free form are shown in purple and blue, respectively. The divalent metal ion (labeled as M2+) is shown in orange. (B, C) SA-omit maps (mFo-DFc maps) for the lid loop residues in mouse (B) and human (C) SMP30/GNL. The contour levels of the SA-omit maps are 3.0 σ and 2.0 σ for panels B and C, respectively. (D) Surface representation of mouse SMP30/GNL around the lid loop. The entrance for the substrate-binding cavity is indicated by an arrow. Residues in the lid loop are shown in purple.
