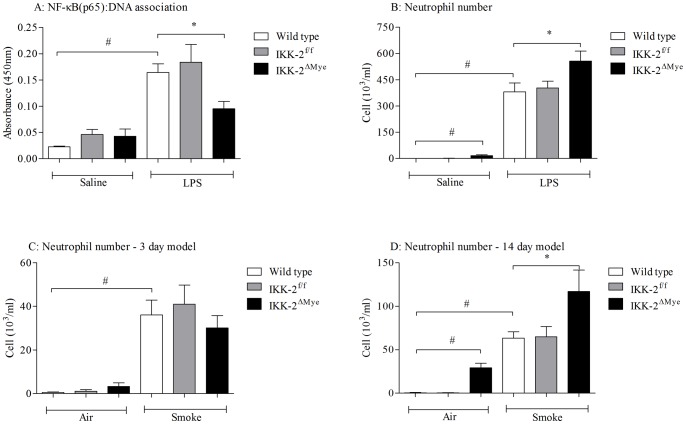
Figure 7. Characterisation of the IKK-2ΔMye mice and inflammatory profile following 3 and 14 day CS exposure.
IKK-2ΔMye mice were challenged with LPS and lung tissue collected 2 hours later and BALF samples 6 hours later. Figure A represents the level of NF-κB pathway activation in the lungs and Figure B the BALF neutrophilia. IKK-2ΔMye mice were challenged with CS for 3 or 14 days and BALF was collected twenty-four hours after the final challenge. Figures C and D represent the numbers of neutrophils in the BALF after 3 and 14 days, respectively. Data are presented as mean ± s.e.m. of n = 8 observations. # indicates a statistically significant difference (p<0.05) from saline/air challenged control groups (Mann-Whitney test). * indicates statistical significance (p<0.05) from LPS/CS treated control groups by Kruskal-Wallis one-way-ANOVA with Dunn's multiple comparison post-hoc test. Bars with no annotation were not significantly different from their respective control group.

