
Figure 1. Schematic representation of the interaction between the two growth strategies.
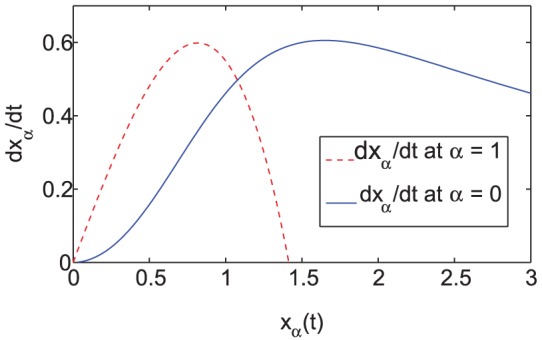
Depending on the initial composition of the population (the number of clones conforming to one strategy over the other), either s-clones or r-clones have higher fitness (larger value of  ). At the intersection of the two curves, neither strategy gives the clones an advantage, regardless of the distribution of clones in the population (i.e., regardless of the value of
  ).
).