
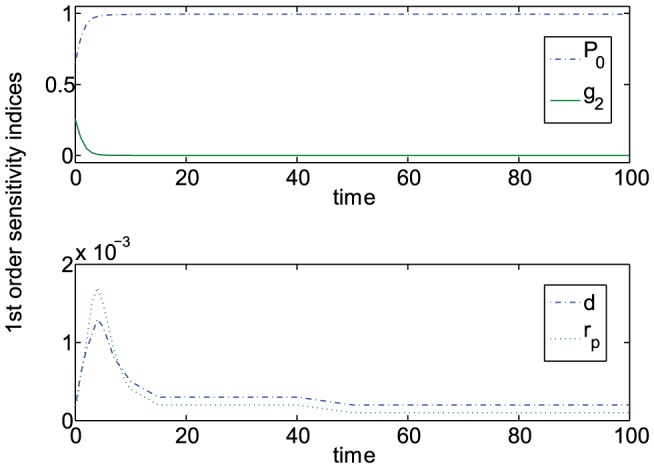
Figure 2. First order sensitivity indices defined as the fraction of the total variance in system behavior caused by the variation in each parameter value.
Calculations were performed for a 13-parameter vector V = [ ,
,  ,
,  ,
,  ,
,  ,
,  ,
,  ,
,  ,
,  ,
,  ,
,  ,
,  ,
,  ], using the FAST method and under the assumption that parameters are varied uniformly by no more than 25%. Due to vast differences in relative importance of different parameters, the results are reported on two separate graphs; only parameters with sensitivity indices over 1% are reported.