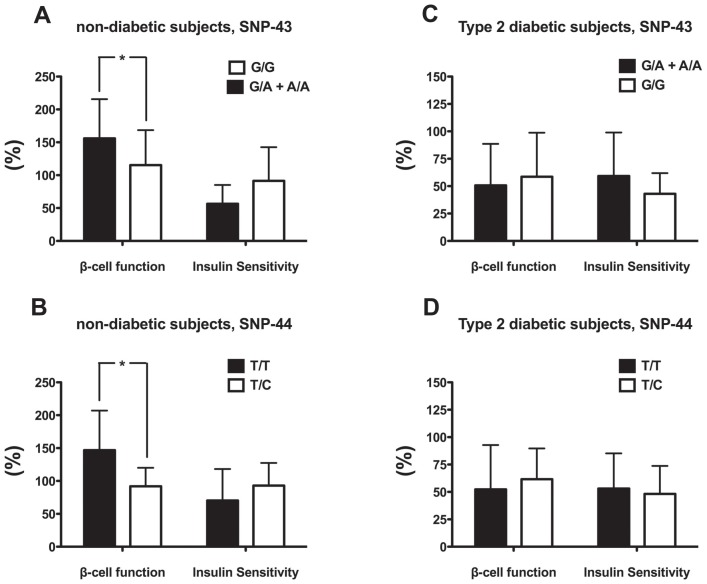
Figure 2.
Beta-cell function and insulin sensitivity (%) stratified by CAPN-10 genotype (SNP-43 and -44) in A) non-diabetic subjects, SNP-43, B) non-diabetic subjects, SNP-44, C) Type 2 diabetic subjects, SNP-43 and D) Type 2 diabetic subjects, SNP-44. Values represent mean ± SD. Symbol (*) denotes statistical significance p<0.05 between alleles (G/G vs. G/A+A/A for SNP-43 and T/T vs. T/C for SNP-44). Beta-cell function values were Log-transformed for statistical analyses.

