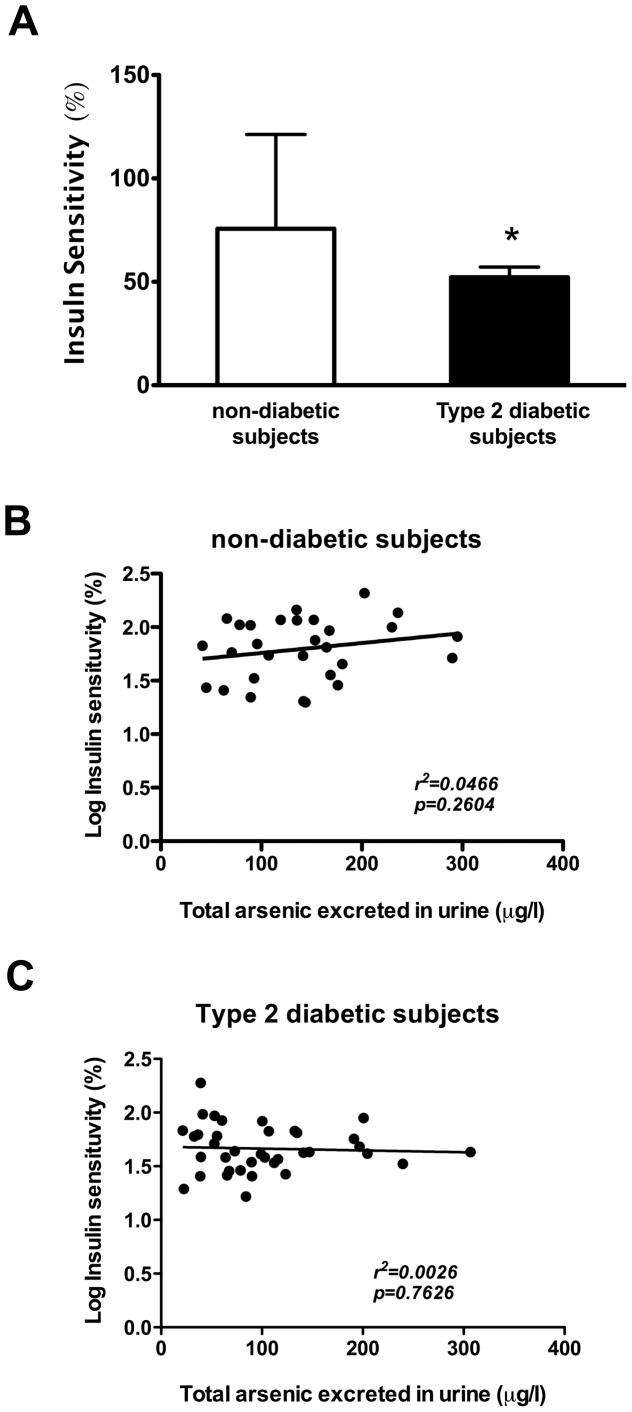
Figure 3. Insulin sensitivity (%) and its association with the concentration of total arsenic excreted in urine.
A) Insulin sensitivity (%) of subjects with and without T2DM; values represent mean ± SD. Symbol (*) denotes statistical significance p<0.05 (data Log-transformed for analysis). B) Linear regression of Log-insulin sensitivity and arsenic in urine in non-diabetic subjects C) Linear regression of Log-insulin sensitivity and arsenic in urine in type 2 diabetic subjects.

