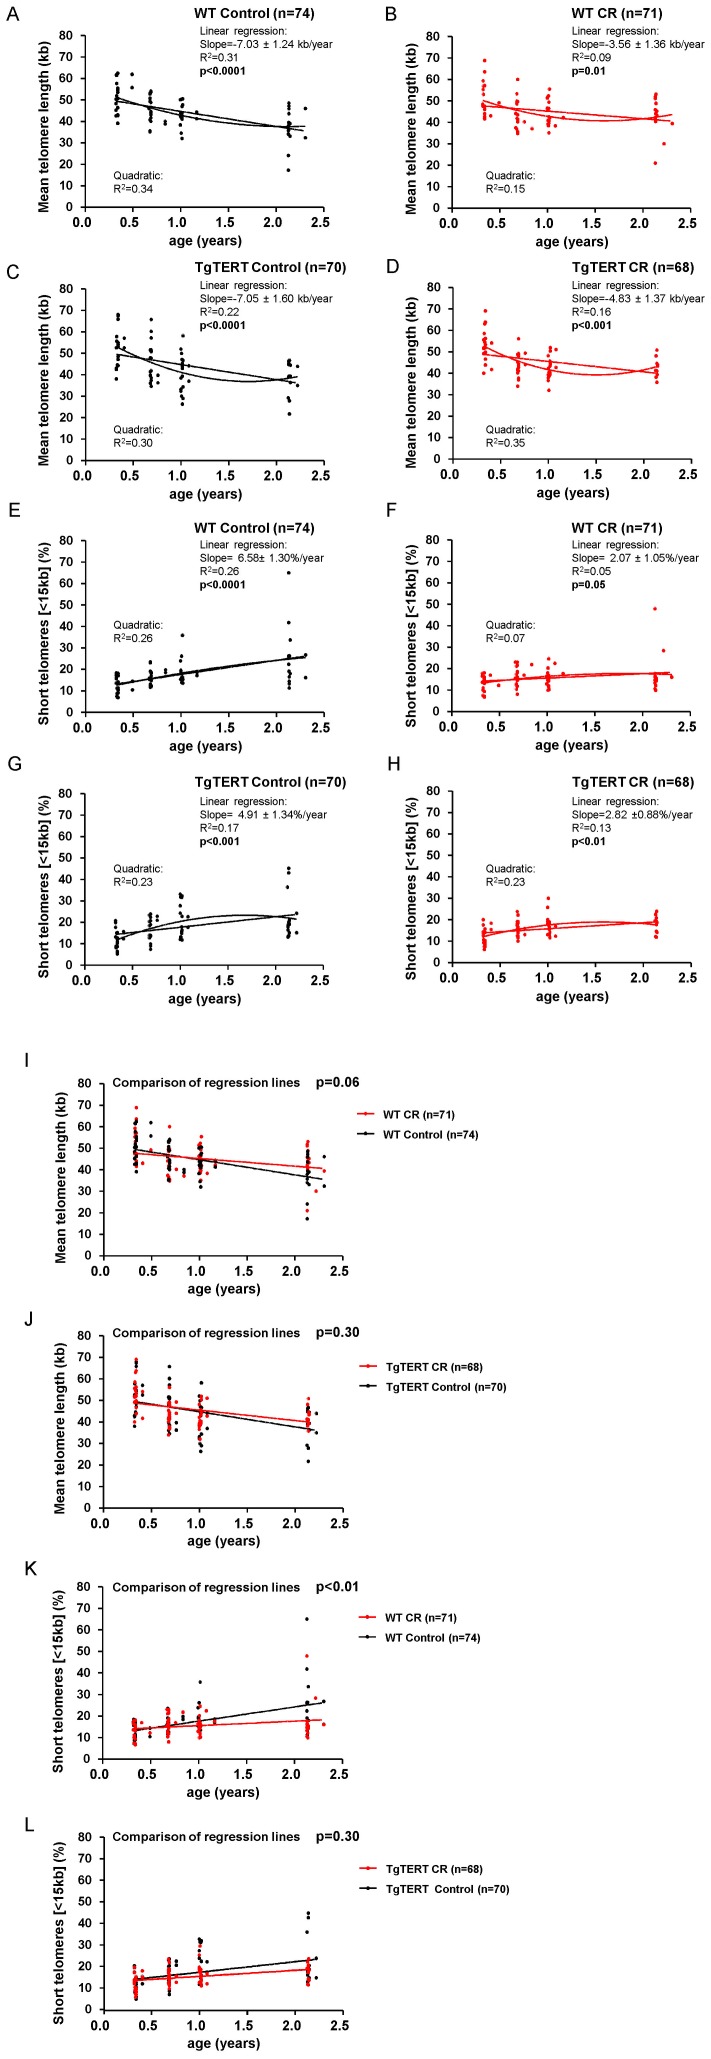
Figure 3. Longitudinal telomere length analyses.
(A, B, C and D) Adjustment of mean telomere length values with aging to a linear model or, alternatively, to a quadratic model in the indicated mouse cohorts. Linear regression analysis was used to measure the association between age and mean telomere length. The slope of the regression line is indicated and represents the rate of telomere shortening per year (Kb). Second order polynomial adjustment (quadratic) was used for the non-linear fit model. The R2 indicates the goodness of the data adjustment to each model. The number of mice per group is shown (n). (E, F, G and H) Adjustment of the percentage of short telomeres (<15kb) to a linear model or alternatively to a quadratic model in the indicated mouse cohorts. Linear regression analysis was used to measure the association between age and the percentage of short telomeres. The slope of the regression line is indicated and represents the percentage of short telomeres enrichment per year. Second order polynomial adjustment (quadratic) was used for the non-linear fit model. The R2 indicates the goodness of the data adjustment to each model. The number of mice per group is shown (n). (I and J) Linear regression lines of the association between age and mean telomere length are shown for mice under CR (red lines) or a control diet (black lines), in both WT (I) and TgTERT (J) backgrounds. Multiple regression analysis was used to evaluate the statistical differences between the slopes of the different linear regression lines. The number of mice in each group is indicated (n). (K and L) Linear regression lines of the association between age and the percentage of short telomeres (<15 kb) are shown for mice under CR (red lines) or a control diet (black lines), in both WT (K) and TgTERT (L) backgrounds. Multiple regression analysis was used to assess the statistical differences between the different linear regression lines. The number of mice in each group is indicated (n).

