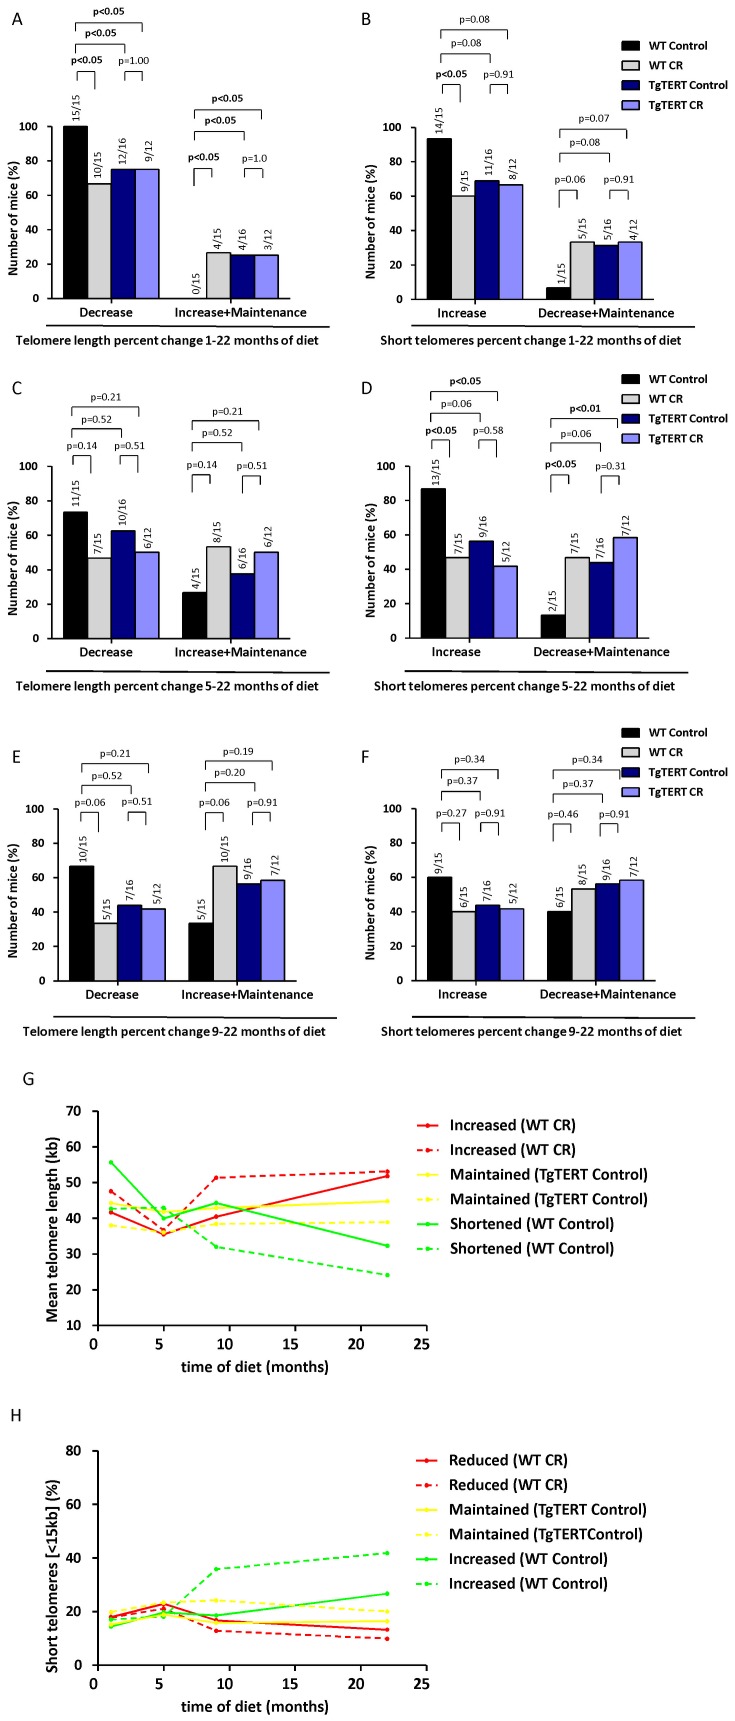
Figure 4. Calorie restriction leads to telomere maintenance and/or elongation with time in a percentage of mice.
(A, C and E) The behavior of mean telomere length was classified in two different profiles (“Decrease” and “Increase or Maintenance”) at different times of diet (1–22 months of diet, 5–22 months of diet and 9–22 months of diet; A, C and E, respectively) in the indicated groups. Numbers above bars indicate the number of mice showing the profile of interest over the total number of mice. Chi-squared test was used to assess the statistical significance of the differences observed. (B, D and F) The behavior in the percentage of short telomeres (<15 kb) was classified in two different profiles (“Increase” and “Decrease or Maintenance”) at different times of diet (1–22 months of diet, 5–22 months of diet and 9–22 months of diet; B, D and F respectively) in the indicated groups. Numbers above bars indicate the number of mice with the profile of interest over the total number of mice. Chi-squared test was used to assess the statistical significance of the differences observed. (G and H) Representative examples of the different assigned profiles for mean telomere length (“Increased”, “Maintained”, and “Shortened”) and percentage of short (<15 kb) telomeres (“Reduced”, “Maintained”, and “Increased”).

