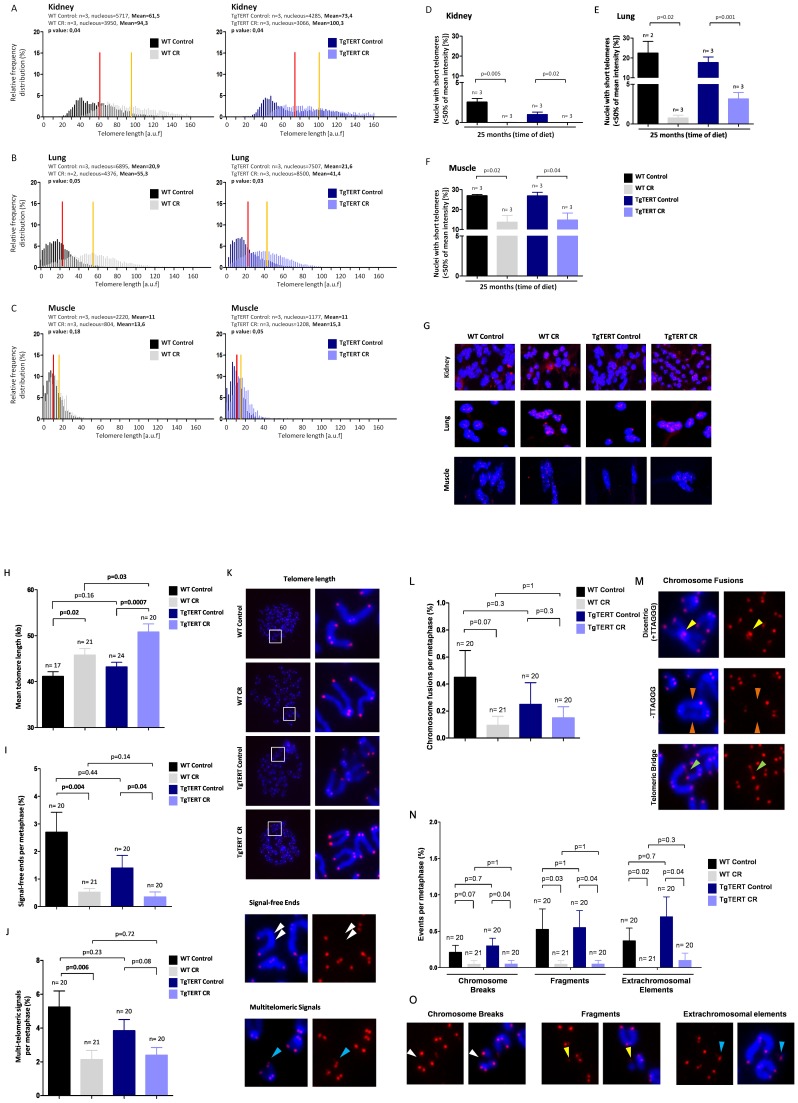
Figure 5. Calorie restriction prevents telomere shortening in different mouse tissues and protects from telomere-mediated chromosomal aberrations in bone marrow cells.
(A,B,C) Telomere fluorescence as determined by QFISH in the indicated tissues from the different mouse cohorts studied here. Histograms represent the frequency (in percentage) of telomere fluorescence per nucleus (in arbitrary units of fluorescence [auf]). Mean telomere length is indicated by a straight line, red for mice under a control diet and yellow for mice under CR. The number of mice (n) and the total number of nuclei analysed is indicated. (D,E,F) Percentage of short telomeres (fraction of telomeres presenting intensity below 50% of the mean intensity) in the indicated tissues from the different mice cohorts studied as determined by QFISH. Student´s t-test was used for statistical analysis. (G) Representative QFISH images for different tissues from the indicated cohorts. Blue colour corresponds to chromosome DNA stained with DAPI; red dots correspond to telomeres (TTAGGG repeats). (H) Telomere length measured in metaphase spreads of BM cells from the different cohorts after hybridization with DAPI and a fluorescent Cy3 labelled PNA-telomeric probe. (I) Frequency of signal-free ends per metaphase in BM cells from the indicated mouse cohorts. (J) Frequency of multitelomeric signals (MTS) per metaphase in BM cells from the indicated mouse cohorts. (K) Representative QFISH images of metaphases from the indicated mouse cohorts. Blue, DNA stained with DAPI; red, telomeres (TTAGGG repeats). (L) Frequency of chromosome fusions per metaphase in BM cells from the indicated mouse cohorts. (M) Representative images of chromosomal fusions. (N) Frequency of other chromosome aberrations (chromosome breaks, fragments and extrachromosomal elements) per metaphase in BM cells from the indicated mouse cohorts. (O) Representative images of the different types of chromosomal aberrations scored. Blue, DAPI staining (DNA); red dots, telomeres (TTAGGG repeats) as detected with a PNA-Cy3 probe.

