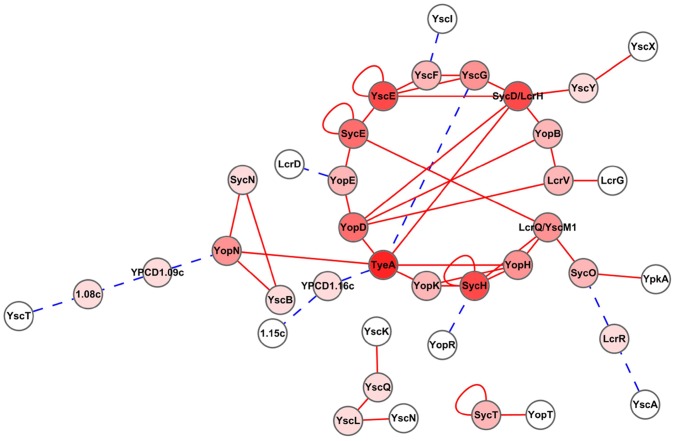
Figure 3. Graphic view of the protein-protein interaction network of Yersinia T3SS.
The graphic view of the network was drawn using Cytoscape 2.0 software [47]. All the functionally well characterized interactions among Yersinia type III secretion apparatus components and the potential novel interactions identified in this study were included. The darker colors indicate the higher centrality of a protein in this network. Red lines indicate known interactions that had been reported and functionally validated by biochemical methods. Blue and dotted lines indicate novel interactions identified by our yeast mating assays.

