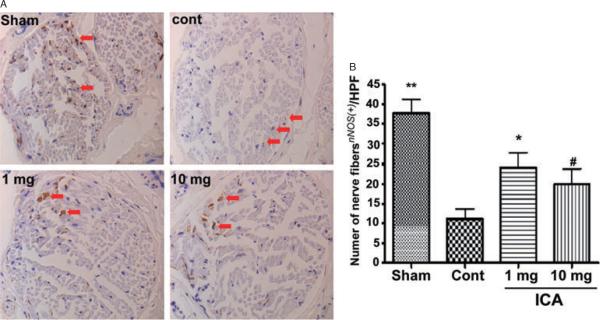
Figure 2.
nNOS Immunohistochemistry. (A) representative images from rats in the sham, control, ICA 1 mg/kg, and ICA 10 mg/kg groups (arrows indicate small positive staining fibers); (B) mean nNOS positivity in the sham, control, ICA 1 mg/kg, and ICA 10 mg/kg groups (**P < 0.05 vs. all other groups, *P < 0.05 and #P < 0.08 vs. control group).
hpf = high-power fields; ICA = icariin.

