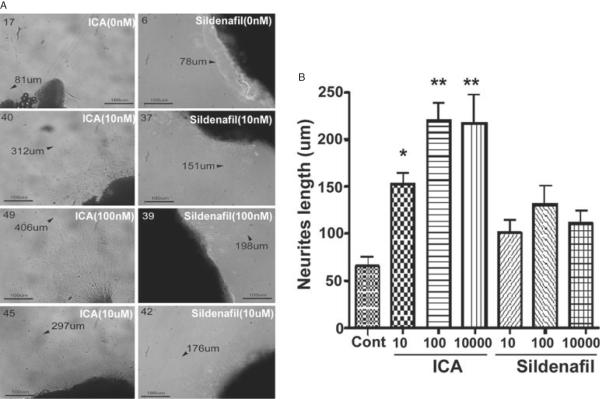
Figure 7.
Neurite outgrowth in cell culture under various treatment conditions. (A) Representative images from cultured major pelvic ganglia in the control (top two panels), ICA (left column) and sildenafil (right column). Arrows and numbers indicate length and position of longest neurite; (B) mean neurite length in the various treatment groups (*P < 0.05 vs. control, **P < 0.05 vs. control and all sildenafil groups).
ICA = icariin.

