
Figure 2.
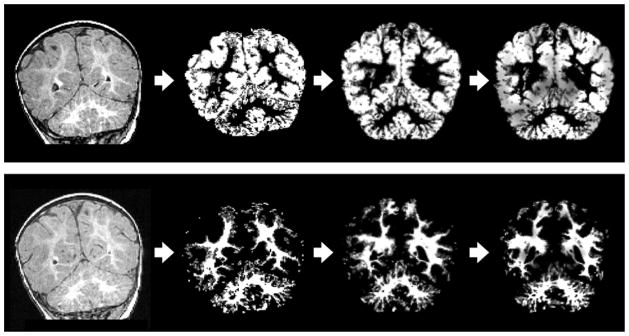
VBM analysis progression for subject 16356: T1-weighted raw MR image in original space (column 1), probability image in original space (column 2), probability image which has been coregistered to the study specific template (column 3), image corrected for the amount of local gray-matter or white-matter using the Jacobian transform (column 4). Row 1 shows VBM analysis progression for gray-matter at the level of the cerebellum (coronal), and row 2 shows VBM analysis progression for white-matter at the level of the cerebellum (coronal).