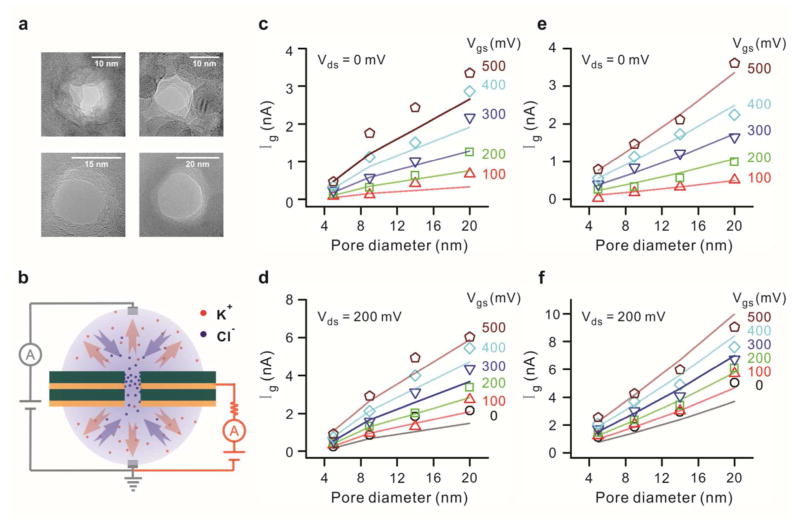
Figure 5.
Gate current dependence on pore diameter (a) TEM images of nanopores of four different diameters (5, 9, 14, 20 nm) nanopores drilled through an embedded graphene membrane. (b) Schematic diagram of electrochemistry. The positive gate bias leads to attraction of chloride ions to the nanopore and expulsion of potassium ions. Red dots and arrows represent potassium ions while blue dots and arrows are for chloride ions. (c–f) Scaling of gate current with pore size at drain bias of 0 and −200 mV for 4 different pore diameters. (c), (d) Gate current dependence on pore diameter using 10 mM KCl solution. Linear dependence on pore diameter is observed over gate bias ranging from 0 to +500 mV for both drain bias values. (e), (f) Gate current dependence on pore diameter using 1 M KCl solution. Similar linear dependence on pore diameter is observed entire voltage range. The scatter points are experimental numbers while the straight lines are simulation fits. Both solutions are prepared with 10 mM Tris and 1 mM EDTA for buffering at pH 7.6

