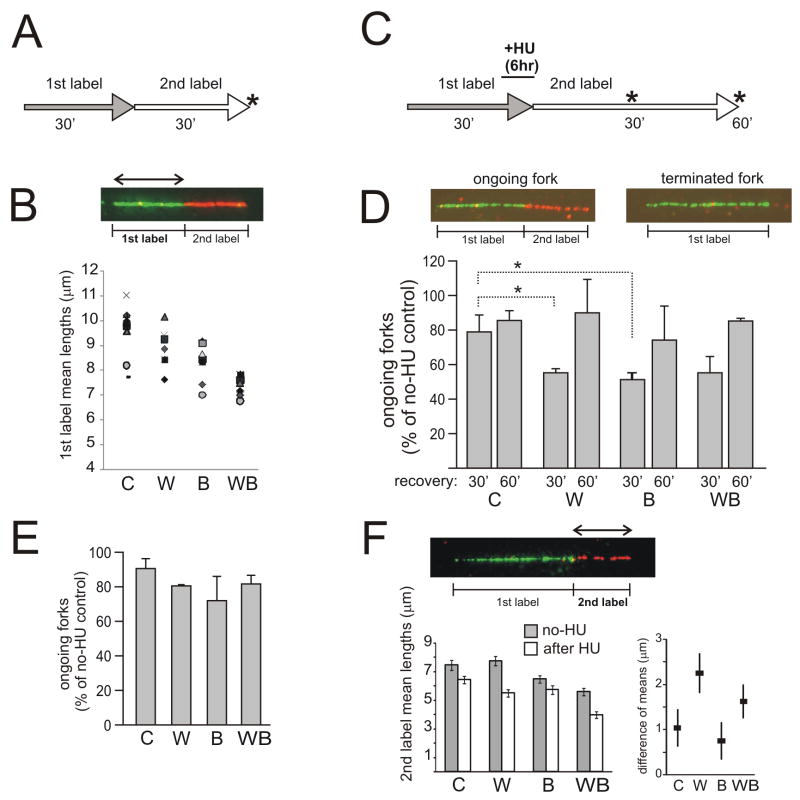
Figure 1.
WRN and BLM exert additive effects on replication fork progression in a normal S phase, and non-additive effects on fork reactivation after HU. A) Labeling scheme. Asterisks mark sample collection time points. B) Example of a two-color, ongoing fork in which 1st label segments were measured. Lengths (in μm) of 1st and 2nd label segments in these ongoing forks were measured in up to 9 independent experiments. Mean values of 1st label segments derived in each experiment are plotted as a function of shRNA type. Different markers stand for individual experiments. See Supplemental Tables S1 and S2 for additional information. Designations here and elsewhere are: C, cells mock-depleted with no-shRNA lentivirus pLKO.1; W, WRN-depleted cells; B, BLM-depleted cells; WB, WRN/BLM-depleted cells. C) Labeling scheme for HU arrest/recovery experiments. 2mM HU was added at the end of a 30min 1st labeling interval. In 6 hrs, HU and the 1st label were removed and 2nd label was added. D) Ongoing forks (1st label–2nd label) and terminated or inactivated forks (1st label only) were counted to determine prevalence of ongoing forks. Track counts per experiment, for each cell type, totaled 361 on average. Fork reactivation after HU was expressed as prevalence of ongoing forks seen after HU, normalized to the prevalence of ongoing forks in untreated cells. These values were obtained from two independent experiments and averaged. Error bars are standard deviations. One-tailed Pvalues were determined in t-tests in pair-wise comparisons between control and depleted cells. PC/W=0.0417 (marked as *), PC/B=0.034, PC/WB=0.065. E) Fork reactivation in cells that have been labeled as in (C), but exposed to 0.5mM HU for 6 hrs and allowed to recover from HU for 30min. F) Mean lengths of 2nd label segments were measured in ongoing forks w/o HU and in forks reactivating after a 6-hr treatment with 0.5mM HU. The values were obtained in two independent experiments and pooled (the average number of measurements, N, per pooled sample was 363). Error bars are 95% confidence intervals of the means. The left panel shows mean lengths w/o HU and after 0.5mM HU, and the right panel shows differences between these means (μno-HU − μHU, black squares), and 95% confidence intervals for each difference (error bars). See Figure S1C and Table S3 for supporting information.

