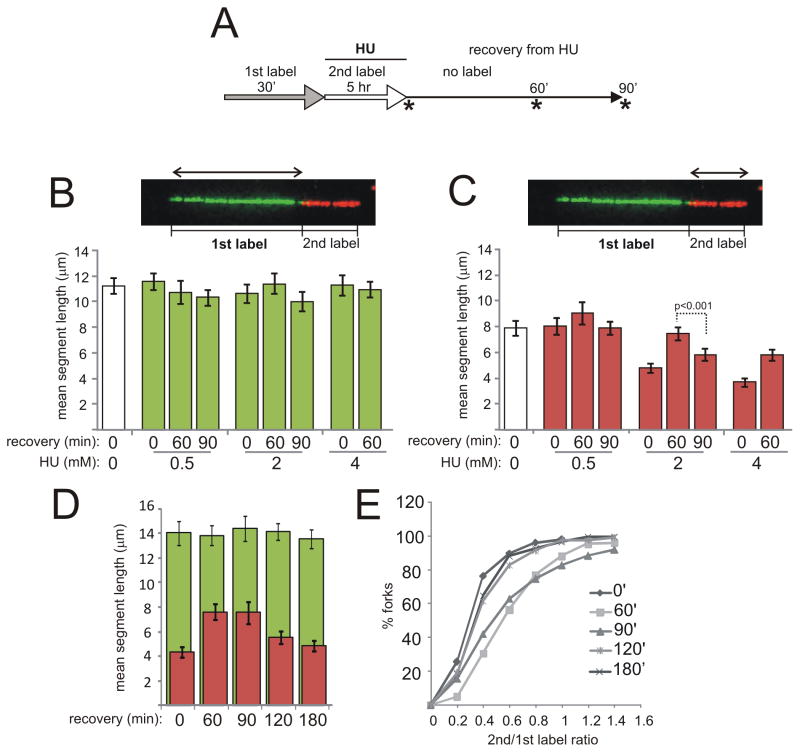
Figure 2.
Nascent strand processing is observed in replication forks of primary human fibroblasts recovering from HU. The Figure presents data from two independent, representative experiments (panels B, C and panels D, E). The average N per sample was 134. A) Labeling scheme. Samples were collected at time points marked by asterisks. The types of track segment length measurements collected in this experiment are shown in images in (B) and (C). Mean lengths of 1st label (B) and 2nd label (C) segments in reactivated forks were determined for each HU treatment and recovery regimen. White bars in each graph are reference values for ongoing forks labeled without HU and for 30 min each with 1st and 2nd label. Error bars are 95% confidence intervals of the means, and a representative P value shown above bars was determined in Mann-Whitney U test. See Figure S2A and B for supporting information. D) An independent experiment in primary fibroblasts showing mean 2nd label segment gain and loss after release from 2mM of HU as well as respective 1st label segment means. E) The same data as in (D) were plotted as ratios of 2nd to 1st label segment lengths for each two-segment fork. Shown is a cumulative distribution, i.e. a Y axis shows a fraction of values in a dataset that are equal to or less than a given value on an X axis.

