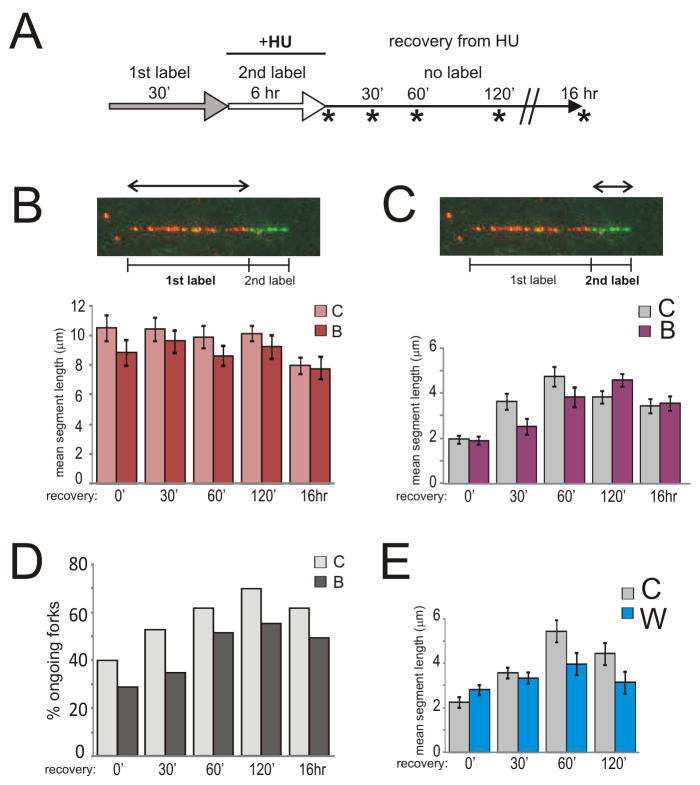
Figure 3.
WRN and BLM helicases differentially affect post-HU DNA synthesis. A) Labeling scheme. Mean lengths of 1st label (B) and 2nd label (C) segments in reactivated forks were determined for the specified time points during recovery from 2mM HU/6hr arrest in controls and BLM-depleted cells. D) Percent of reactivated forks (i.e. forks containing consecutive 1st and 2nd label segments) among all forks containing the 1st label measured in samples shown in (B) and (C). Panels B, C, and D describe a representative experiment. The average N per sample was 125 ongoing fork tracks for (B) and (C), and 306 total tracks for (D). E) Mean lengths of 2nd label segments in reactivated forks were determined for the specified time points during recovery from 2mM HU/6hr arrest in controls and WRN-depleted cells. Shown are results of a representative experiment. The average N per sample was 103. Error bars in panels B, C, E are 95% confidence intervals of the means.

